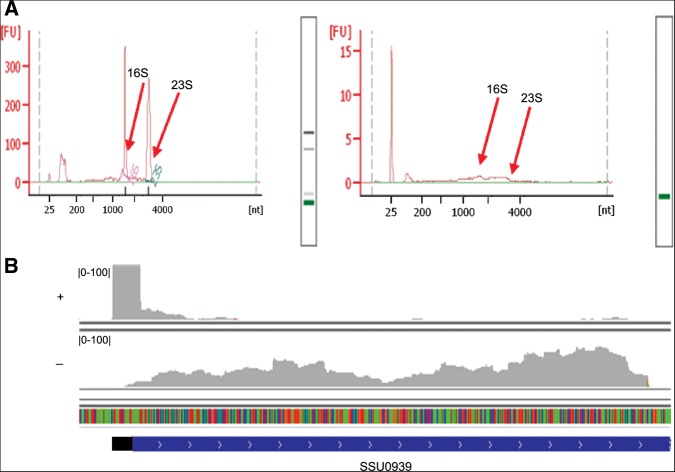
FIGURE 1.
Characteristics of sequencings. (A) Analysis of RNA before (left) and after (right) TEX treatment using a Bioanalyzer 2100. The peaks of 23S and 16S are significantly declined after TEX treatment, so the fluorescence absorption signals of the RNAs become weak. (B) The cDNA reads with (+) or without (−) TEX treatment mapped to the SS genome. The coding sequence and 5′ UTR of SSU0939 are indicated by blue and black bars, respectively, and the arrows on the blue bar show the direction of the gene.

