FIGURE 8.

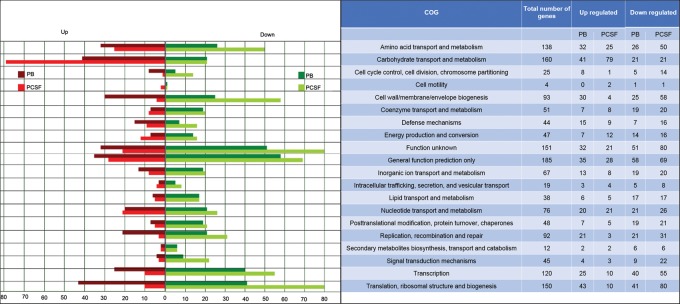
Gene expression analysis. (Left) Bars indicate the numbers of genes with modified expression in PB or PCSF relative to PC. (Right) Genes were classified into 20 main functional categories in the COG database.

Gene expression analysis. (Left) Bars indicate the numbers of genes with modified expression in PB or PCSF relative to PC. (Right) Genes were classified into 20 main functional categories in the COG database.