
FIGURE 2.
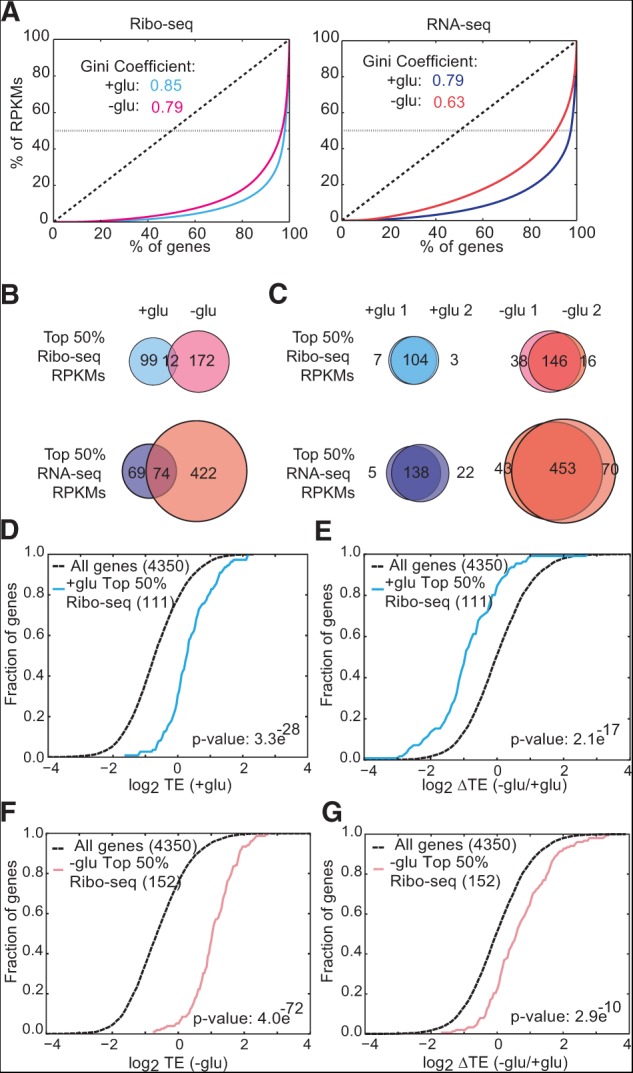
Gene-specific translation efficiencies are adapted to growth conditions. (A) Gini coefficient plots of yeast genes versus Ribo-seq (left) and RNA-seq (right) reads per kilobase per million mapped reads (RPKMs) represent the heavily skewed gene expression profiles in different growth conditions. The dotted horizontal lines represent the top 50% of RPKMs from each library. (B) The translated mRNA pool differed substantially depending on growth conditions (±glucose). Venn diagrams represent the genes that make up the top 50% of RPKMs from each library. (C) The identities of the most highly expressed and translated mRNAs were reproducible between biological replicates. Venn diagrams represent the genes that make up the top 50% of RPKMs from each library. (D) Cumulative distribution (CDF) plot for translational efficiency (Ribo-seq RPKM divided by RNA-seq RPKM) in +glu of the top 50% of genes by Ribo-seq RPKMs in +glu. (E) CDF plot for changes in TE upon glucose withdrawal of the top 50% of genes by Ribo-seq RPKMs in +glu. (F) CDF plot for TE in −glu of the top 50% of genes by Ribo-seq RPKMs in −glu. (G) CDF plot for changes in TE upon glucose withdrawal of the top 50% of genes by Ribo-seq RPKMs in −glu. Individual replicates were used to identify the top 50% genes. TEs are the average of two biological replicates. Significance was determined by the Kolmogorov-Smirnov test.