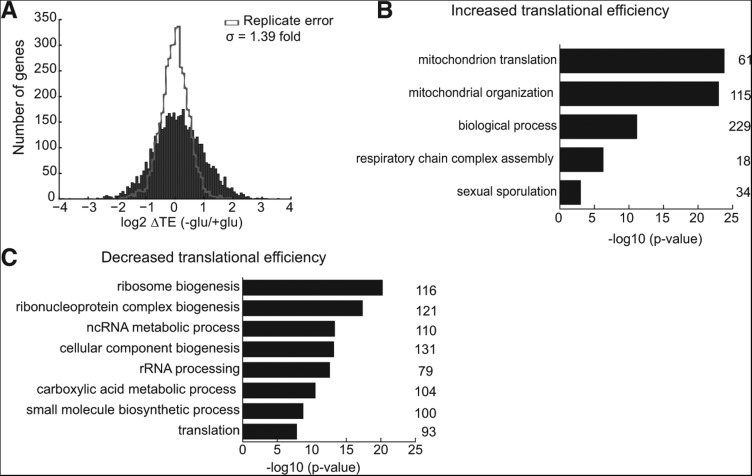
FIGURE 3.
RP and mito mRNAs differentially translated upon glucose withdrawal. (A) Distribution of changes in TE in glucose-starved cells. (B) GO category enrichment of genes whose TE increases ≥2-fold (FDR < 1%) in glucose starvation. The number of genes in each category is indicated to the right of the graph. (C) GO category enrichment of genes whose TE decreases ≥2-fold (FDR < 1%) in glucose starvation. The number of genes in each category is indicated to the right of the graph.

