
Figure 2.
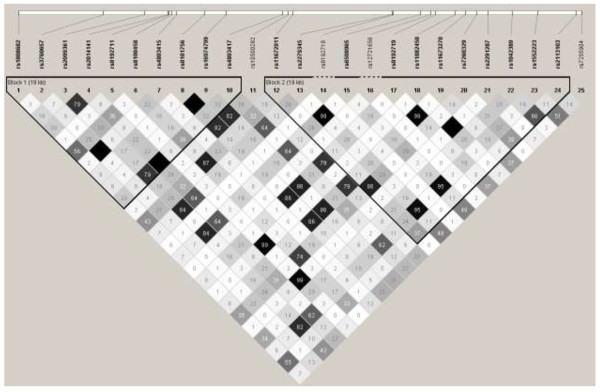
Display over the haplotype structure of the CYP2B6-loci, based on PIVUS genotype data. Darker color corresponds to higher r2 (i.e. correlation) between single nucleotide polymorphisms (SNPs).
Official websites use .gov
A
.gov website belongs to an official
government organization in the United States.
Secure .gov websites use HTTPS
A lock (
) or https:// means you've safely
connected to the .gov website. Share sensitive
information only on official, secure websites.
Display over the haplotype structure of the CYP2B6-loci, based on PIVUS genotype data. Darker color corresponds to higher r2 (i.e. correlation) between single nucleotide polymorphisms (SNPs).