
Fig. 1.
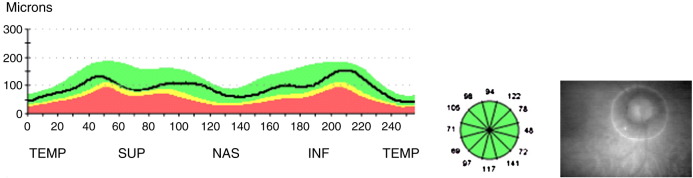
Example of RNFL measurements taken from a healthy eye. Line of graph shows RNFL thickness of the scanning circle as seen around the optic nerve head in the photograph on the right. X axis = position on scanning circle and Y axis = RNFL thickness at different positions. TEMP 169 = temporal, SUP = superior, NAS = nasal, INF = inferior. The colours represent normal distribution percentiles. Green = 95 to 5%, yellow = 5 to 1%, red = 1 to 0%.