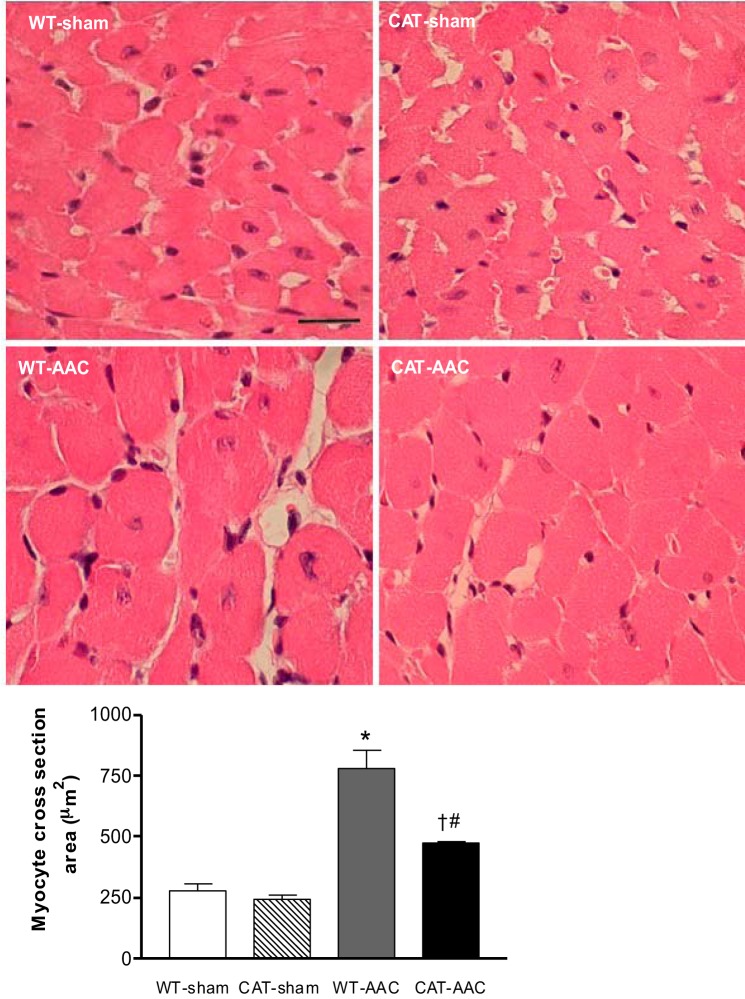
Fig. 3.
Myocyte size in WT and CAT mice 12 wk after surgery. Top: representative photomicrographs of LV sections stained by hematoxyline and eosin. Bar (WT-sham panel) = 25 μm. Bottom: quantification of myocyte cross-sectional area measured using NIH ImageJ. Values are means ± SE; n = 6–8. *P < 0.005 vs. WT-sham or CAT-sham; #P < 0.05 vs. WT-sham or CAT-sham; †P < 0.02 vs. WT-AAC.

