Fig. 4.
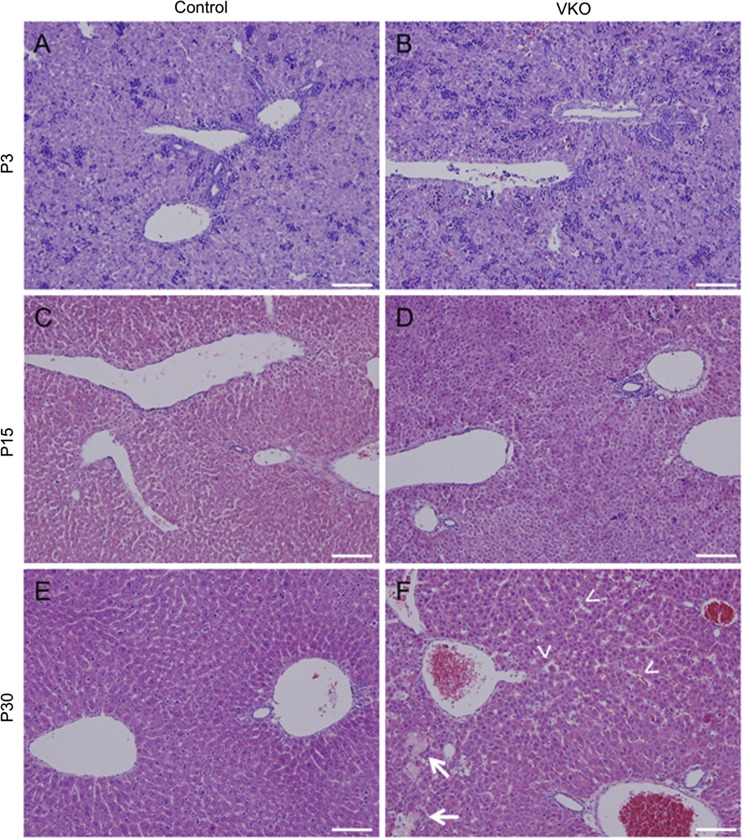
VKO mice display disrupted hepatocyte cords and dilated sinusoids. Hematoxylin and eosin (H&E) stains were done on P3, P15, and P30 control and VKO livers. At P3, no obvious visual differences were observed between control (A) and VKO (B) mice. At P15, VKO mice exhibited abnormal hepatocyte cord morphology (D) compared with controls (C). By P30, VKO mice demonstrate dilated sinusoids (F, arrowheads) compared with control (E). There is also a loss of hepatocyte zonal morphology and focal necrosis (arrows). In the P30 control, an H&E shows subtle differences in the periportal and pericentral hepatocytes; the periportal hepatocytes are more densely associated than the pericentral hepatocytes (E). However, no zonation is apparent in the P30 VKO liver (F). Scale bar is 100 μm.

