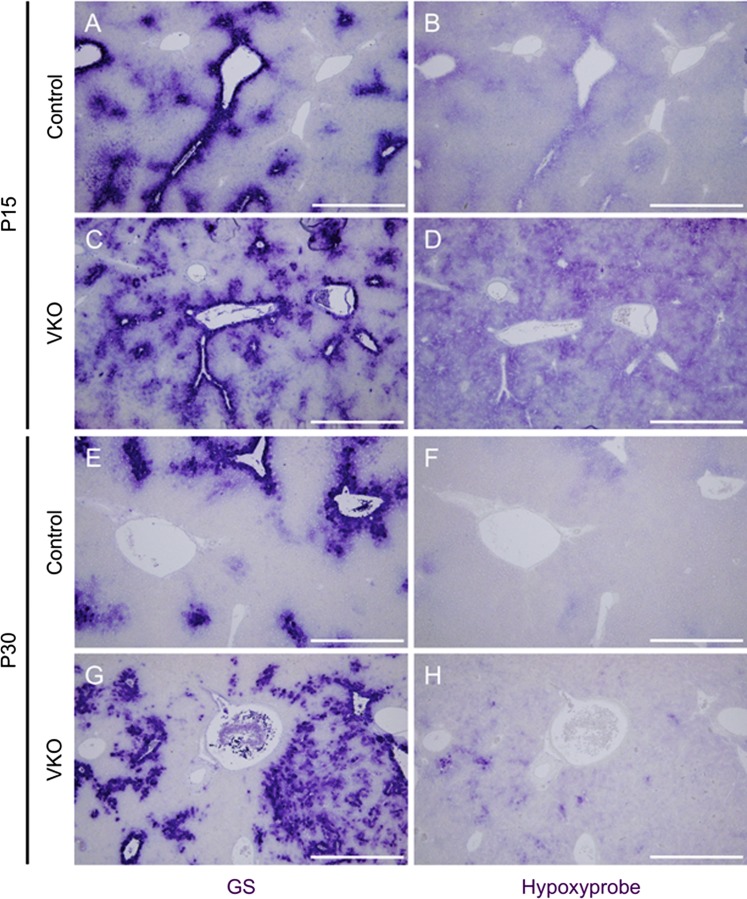
Fig. 7.
VKO mice demonstrate increased hypoxia in the liver that occurs in close proximity to, but does not necessarily overlap, regions of GS expression. Serial sections were used to assess the association of oxygen levels and GS expression in the livers of VKO mice. Hypoxyprobe was injected into mice 90 min before death and assessed by immunohistochemistry (purple, B, D, F, and H). At P15 and P30, control mice display low levels of regional hypoxia, specifically around central veins (B and F). In P15 VKO mice, however, the regions of hypoxia are markedly expanded compared with that observed in control (D). This hypoxia is still present in P30 VKO mice but is not as widespread (H). The regions of hypoxia correspond with regions of GS expression in P15 and P30 controls (A and E). In P15 VKO livers, GS expression correlates with the strongest Hypoxyprobe staining (C and D), but not all hypoxic areas express GS (E and F). In P30 VKO livers, Hypoxyprobe occurs in close spatial association with GS expression, but GS and Hypoxyprobe expression frequently occurs in different cells (G and H). Scale bar is 500 μm.

