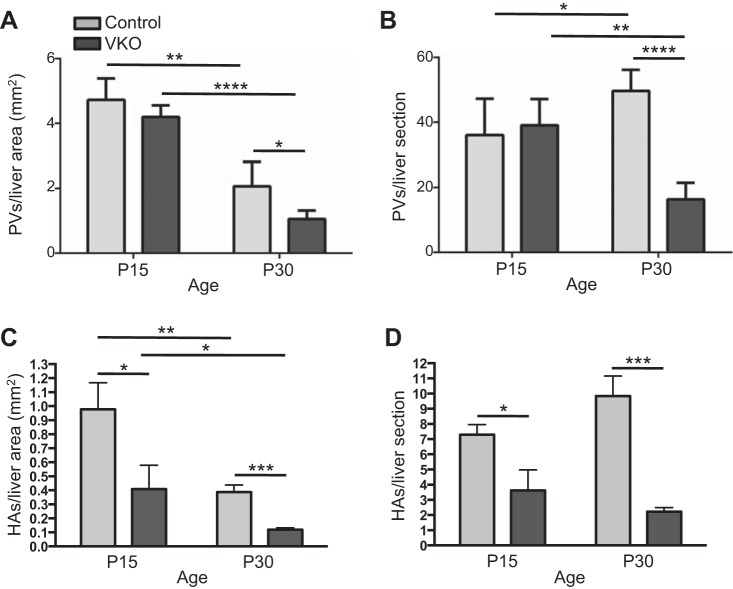
Fig. 8.
VKO mice display a reduction in portal vein (PV) branches and hepatic artery (HA) branches. To count PV branches, liver sections were stained with GS to demarcate central veins (CVs). PVs, defined as any vein not lined by GS+ hepatocytes, were counted. The number of branches per liver area (A) and the number of branches per liver cross section (B) were analyzed. At P15, no difference in PVs/liver area or PV/liver section between control and VKO mice was observed. At P30, VKO mice had significantly fewer PVs per liver area and per section. The number of PVs per area decreased between P15 and P30 in both control and VKO mice (A). The number of PVs per liver section increased in control mice but decreased in VKO mice (B). HA branches were visualized by immunohistochemistry for smooth muscle actin (SMA). Expression of SMA in the arterial mesenchyme marks the major HA branches. The number of branches per liver area (C) and the number of branches per liver cross section (D) were analyzed. At both P15 and P30, VKO mice have fewer HA branches per liver area and per liver section compared with controls (C and D). At least six liver sections per animal were counted. N = 3 (P15) or 4 (P30) for PV counts and N = 4 (P15) or 6 (P30) for HA counts for both genotypes. *P < 0.05, **P < 0.01, ***P ≤ 0.001, and ****P ≤ 0.0001.

