
Fig. 7.
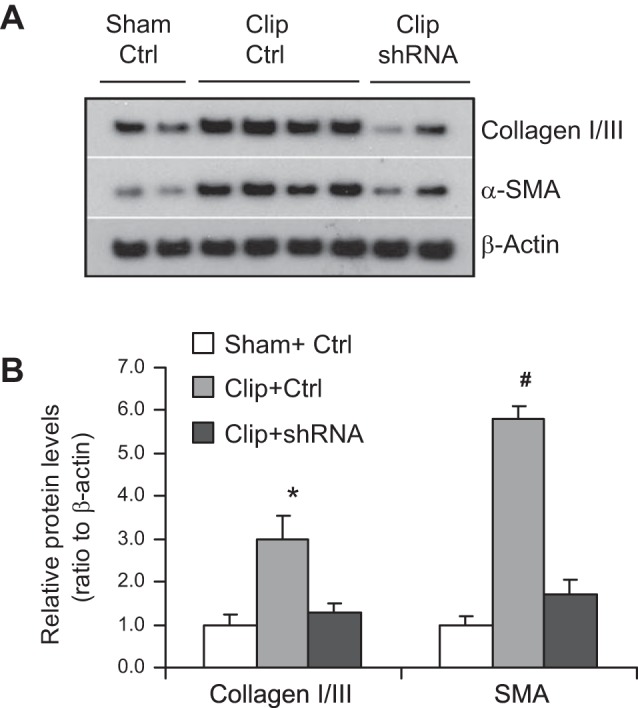
Effect of HIF-1α shRNA on protein levels of collagen I/III and α-SMA in clipped kidneys. A: representative ECL gel documents of Western blot analyses depicting the protein levels. B: summarized blot intensities (normalized to Sham+Ctrl). *P = 0.001 vs. Sham+Ctrl and P = 0.01 vs. Clip+shRNA. #P < 0.001 vs. other 2 groups by 1-way ANOVA with Tukey's post hoc test (n = 7).