Fig. 4.
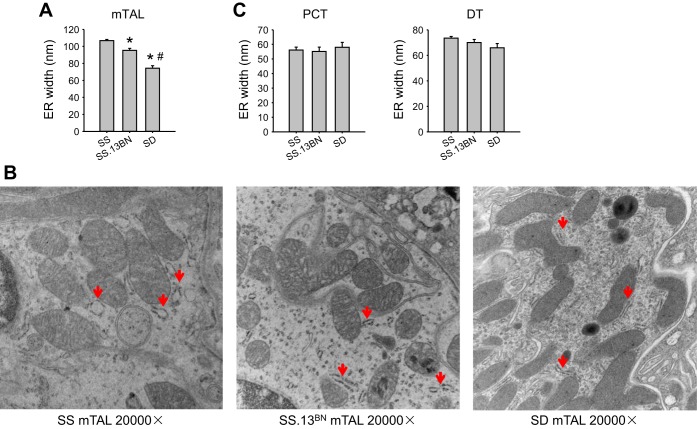
The width of the endoplasmic reticulum (ER) in the mTAL was largest in SS rats, medium in SS.13BN rats, and smallest in SD rats. A: width of the ER in mTALs. B: representative electron microscopic images of mTALs. Red arrows indicate the rough ER. C: width of the ER in PCTs and DTs. n = 4–6. *P < 0.05 vs. SS rats; #P < 0.05 vs. SS.13BN rats.

