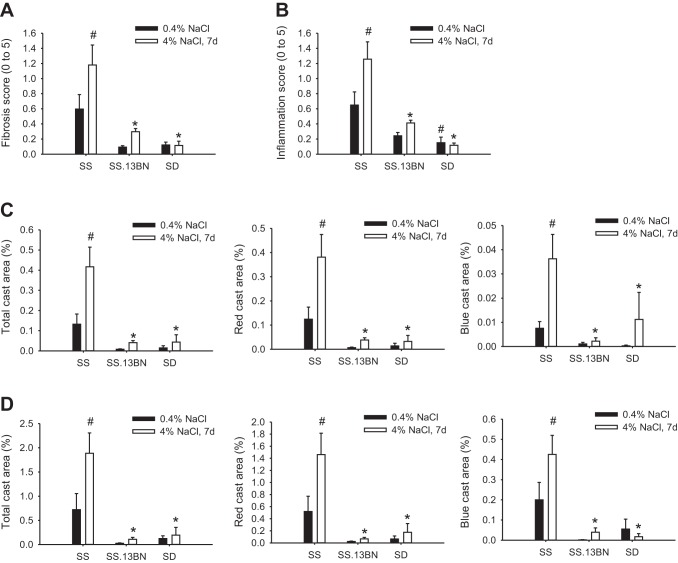
Fig. 5.
Fibrosis, inflammation, and tubular casts affected <5% of the kidney area in SS, SS.13BN, and SD rats on 0.4% NaCl diets or 7 days (7d) of 4% NaCl diets. A: fibrosis scores. A score of 1 indicates that <5% of the area was affected. B: inflammation scores. A score of 1 indicates that <5% of the area was affected. C: cast area (expressed as a percentage of the total area) in the cortex. D: cast area (expressed as a percentage of the total area) in the outer medulla. n = 4–6. *P < 0.05 vs. SS rats on the 4% NaCl diet; #P < 0.05 vs. SS rats on the 0.4% NaCl diet.

