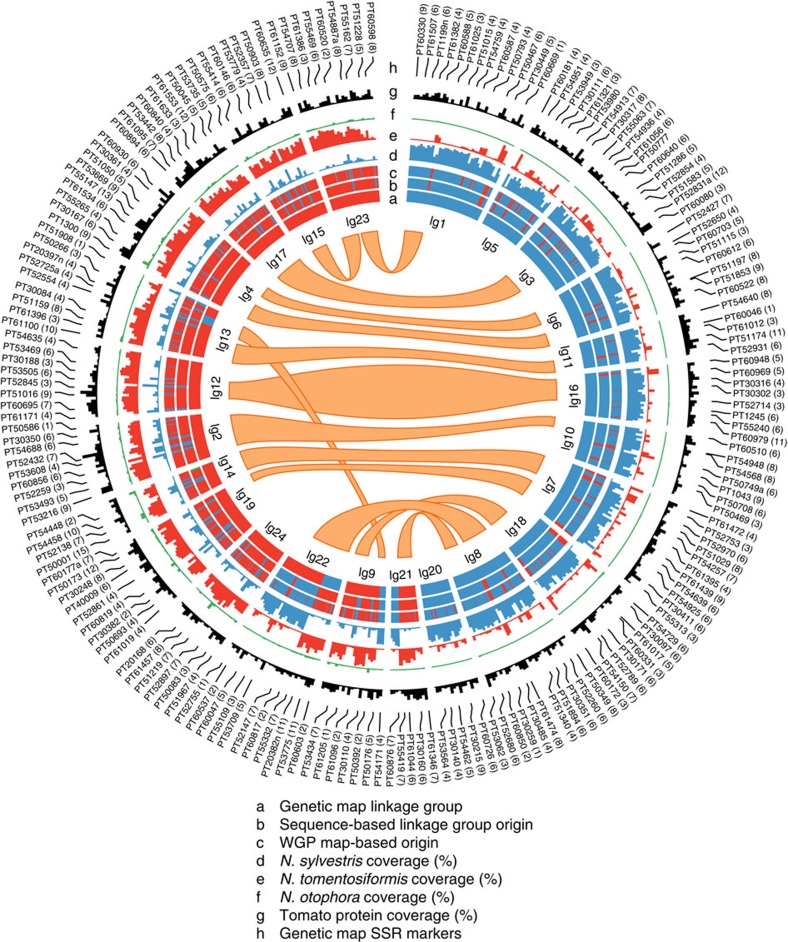
Figure 1. Tobacco genome.
Blue and red represent features of S and T origins in the Nicotiana tabacum TN90 genome, respectively. Track a indicates the origin of the linkage group previously determined by SSR amplification. Track b shows the assignment of the linkage group origin based on sequence identity with N. sylvestris, N. tomentosiformis and N. otophora. Track c shows the origin of the WGP physical map contig used for super-scaffolding. The blue, red and green histograms (tracks d, e and f, respectively) indicate the percentage of each 2 Mb region covered by an N. sylvestris, N. tomentosiformis or N. otophora sequence of at least 1,000 bp and 98% identity. Track g shows the density of coding regions identified by mapping of reference tomato proteins. Track h gives the position of SSR markers mapped to the genome sequences. The centre links regions of the N. tabacum genome based on sequence homology, as determined by reference tomato proteins mapping at two locations.

