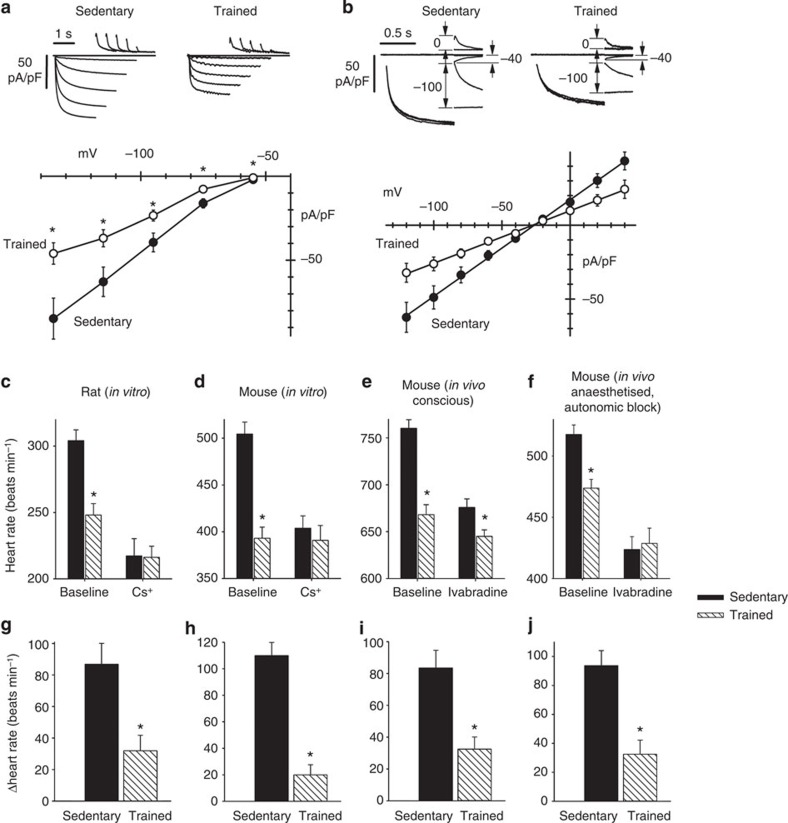
Figure 3. Downregulation of If in the sinus node can explain the training-induced resting bradycardia.
(a) Density of If is reduced in trained mice. Top, representative If traces, normalized to cell capacitance, during steps to -55 to -135 mV (20 mV increments; holding potential −35 mV) from single sinus node cells isolated from sedentary (left) and trained (right) mice. Bottom, mean (±s.e.m.) If IV curves recorded at steady state from sedentary (filled circles; n=17/5 cells per mice) and trained (open circles; n=18/5) mice. Student’s t-test used to test differences between sedentary and trained mice; *P<0.05. (b) Whole-cell conductance of If is reduced in trained mice. Top, sample current traces recorded with the protocol used to measure the fully activated IV relationship of If from single sinus node cells isolated from sedentary (left) and trained (right) mice. Conditioning activating/deactivating voltages were −125 and −35 mV, and pairs of steps to the same test voltage were applied in sequence from these two levels; records shown for test voltages of −100, −40 and 0 mV. Bottom, mean (±s.e.m.) fully activated I/V relationship, normalized to cell capacitance, from sedentary (filled circles; n=9/5 cells per mice) and trained (open circles; n=11/5) mice. Linear fit of data (straight lines) yielded conductances of 653 and 356 pS/pF and reversal potentials of -26.3 and -27.3 mV for sedentary and trained mice. The two curves are statistically different (F-test; P<0.05). (c,d), Spontaneous rate of isolated rat (c; n=7) and mouse (d; n=6/7) sinus node preparations from sedentary and trained animals before and after If block with Cs+. (e,f) Heart rate of sedentary and trained mice when conscious (e; n=9/13) and when anaesthetized and after autonomic block (f) before and after If block with ivabradine (n=7/14). (g–j) Decrease in heart rate (beats min−1) on blocking If in corresponding experiment above (c–f). In c-j, means+s.e.m. shown. Student’s t-test used to test differences between sedentary and trained animals. Normal distribution of data tested using Shapiro–Wilk W-test and equal variance tested using F-test. When null hypothesis of normality and/or equal variance was rejected, non-parametric Mann–Whitney U-test used. *P<0.05.

