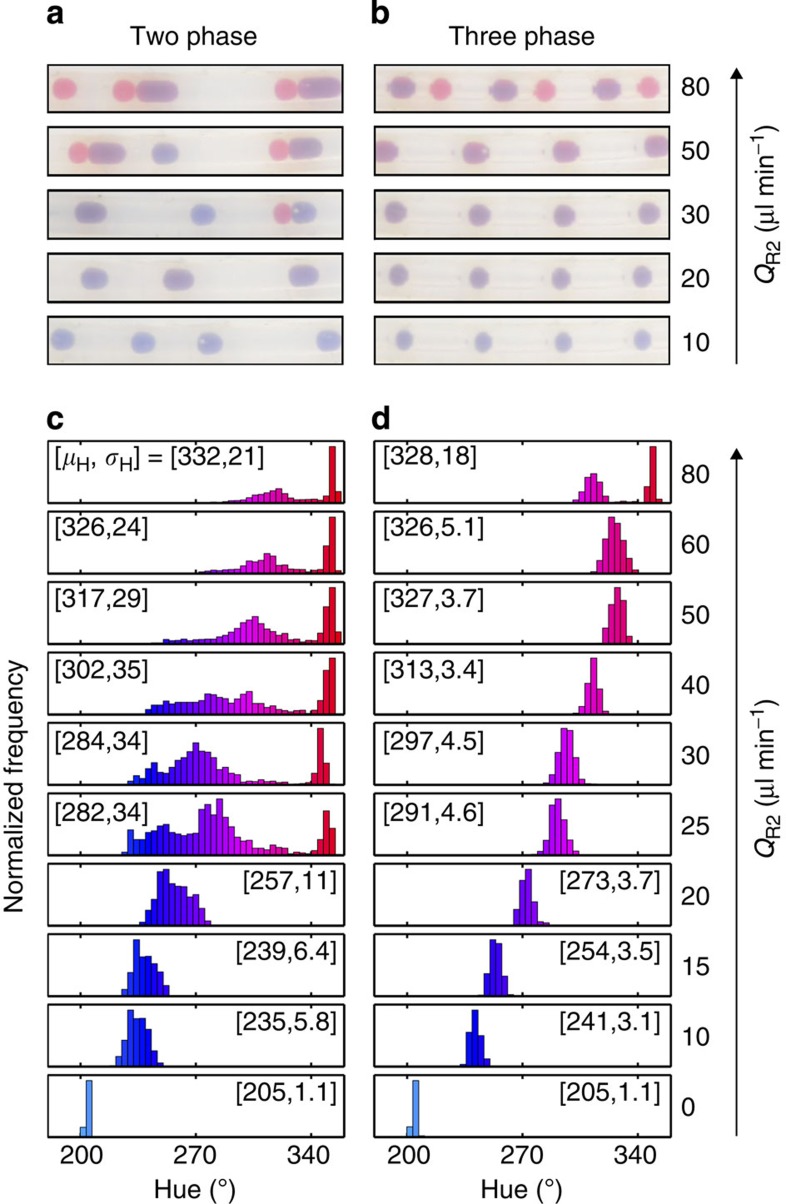
Figure 5. Colorimetric analysis of reagent addition into two- and three-phase fluid streams.
(a,b) Representative images of the flowing droplets after solvent addition for the two- and three-phase flows, under different rates of solvent addition. (c,d) Hue histograms showing the distribution of droplet colours after solvent addition for different rates of solvent addition. The individual bars of the histogram are shaded with the approximate hue they represent, while μH and σH denote the mean and s.d. of the measured hue, respectively.

