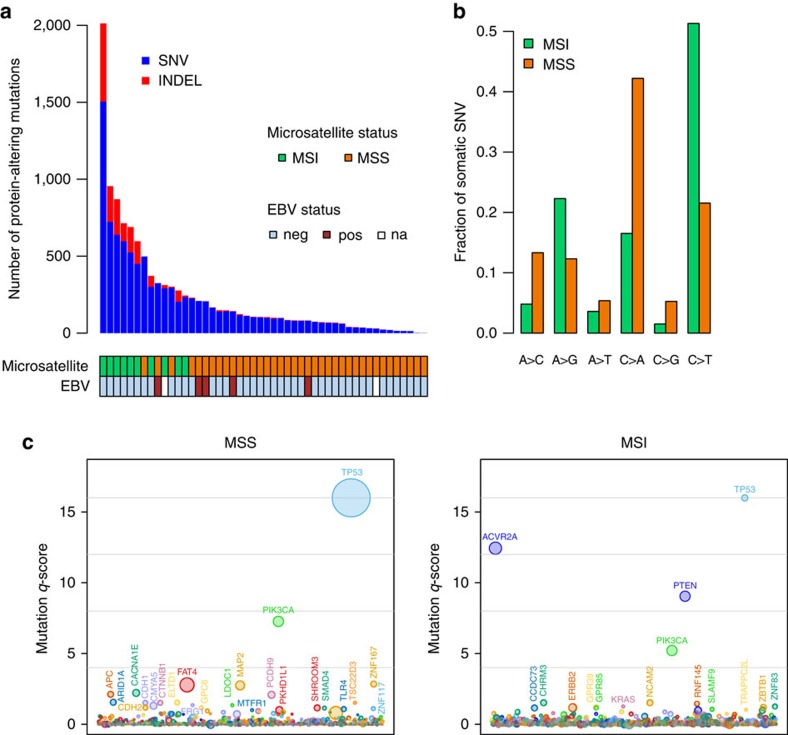
Figure 1. Somatic mutations in gastric cancer.
(a) Number of somatic protein-altering mutations per tumour. Epstein-Barr virus (EBV) status (according to the presence of EBV reads in RNAseq data) and microsatellite status are shown below. EBV status for two samples is not available due to the absence of RNAseq data for the samples. (b) Mutation spectrum varies between MSI and MSS samples. (c) Recurrently mutated genes for MSS (left) and MSI (right) samples by MuSiC analysis. Each circle represents a gene and the size of the circle is proportional to the mutation count for that gene. The genes are represented in alphabetical order from left to right on the x axis. Genes with a statistically significant q-value are labelled.

