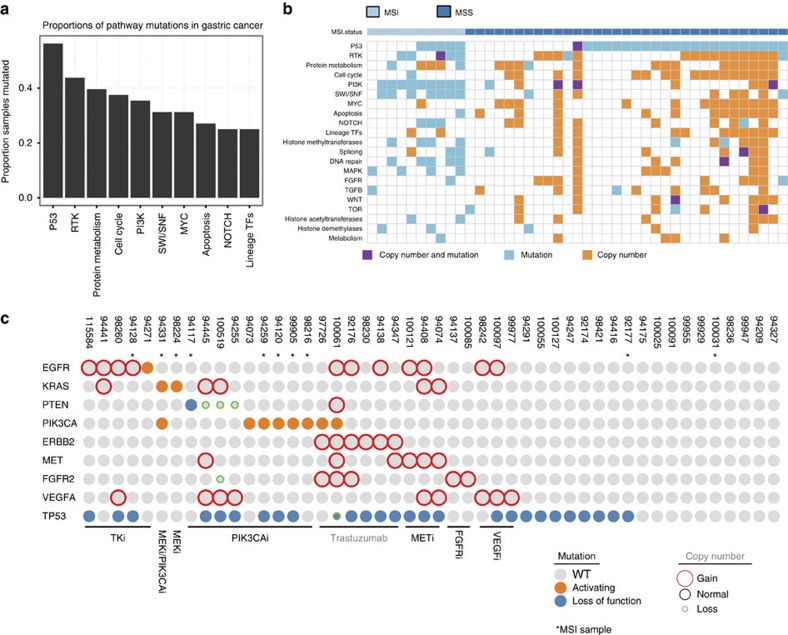
Figure 2. Altered pathways in gastric cancer and potential targeted therapies.
(a) Barplot showing the fraction of samples containing an aberration in curated pathways. Top 10 most altered pathways are shown. Aberrations are defined as mutations or copy number changes in any of the pathway member genes. (b) Matrix showing the distribution of pathway aberrations per sample ordered from most frequently aberrant pathway (top) to least frequently aberrant pathway (bottom). Colours of the matrix indicate whether the pathway was affected by mutation (blue), copy number change (magenta) or both (orange). The colour bar on top shows MSI (green) or MSS (orange) status. (c) Potential targeted therapies that can be applied to this patient population, based on the status of amplification, known activating mutations or loss-of-function mutations of key cancer genes.

