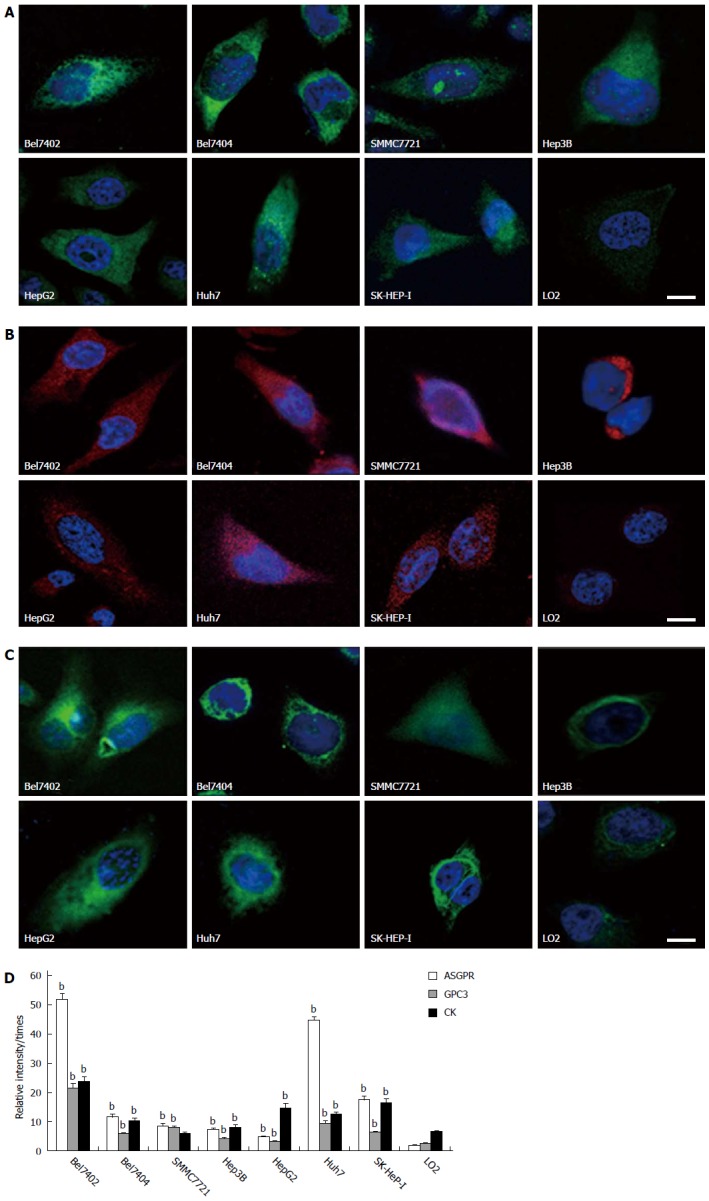
Figure 1.

Asialoglycoprotein receptor, glypican-3 and cytokeratin expression, and fluorescence intensities in eight cell lines. A-C: Representative images of cells on the coverslips with DAPI-stained nuclei (blue) and asialoglycoprotein receptor (ASGPR) staining (green)/glypican-3 (GPC3) staining (red)/cytokeratin (CK) staining (green). The scale bar is 5 μm. D: The bar graph of fluorescence intensities in eight cell lines. Fluorescence intensities were measured using NIH Image J software. Biomarker relative intensities were calculated as the difference between the biomarker staining intensity of the cell and the background intensity. The comparisons between HCC cell lines and the control cell line were analyzed using the Mann-Whitney test (bP < 0.01 vs control).
