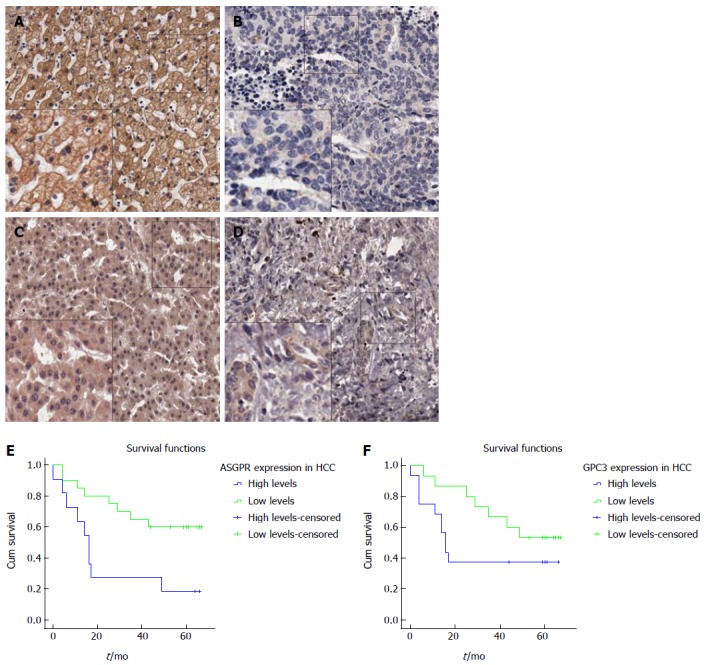
Figure 5.

Representative images of asialoglycoprotein receptor/glypican-3 expression on tissue arrays, and Kaplan-Meier survival curves from follow-up studies. A-B: The expression of ASGPR in HCC (A) and paracarcinomatous (B) tissues. C-D: The expression of GPC3 in HCC (C) and matched paracarcinomatous (D) tissues (A-D: × 100; Inner × 200). The survival curves from six and a half years of follow-up indicate a significant difference between 32 HCC patients with high and low levels of ASGPR (E) and exhibit a trend toward significance between 32 HCC patients with high and low levels of GPC3 (F).
