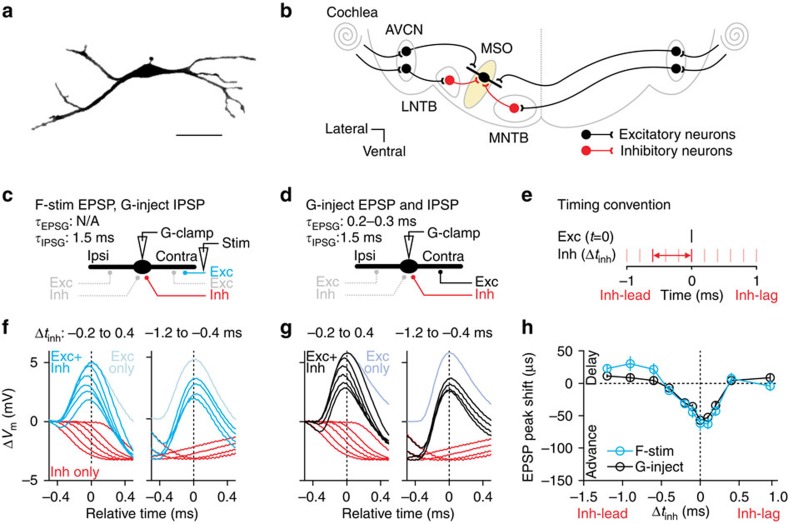
Figure 1. Inhibition modulates the timing of excitation.
(a) Fluorescence micrograph of a P60 MSO neuron. Scale bar, 50 μm. (b) Schematic of input circuitry to the MSO. Ipsilateral (Ipsi) and contralateral (Contra) glutamatergic inputs from the anteroventral cochlear nuclei (AVCN) target the dendrites. Glycinergic inputs from the lateral and medial nucleus of the trapezoid body (LNTB and MNTB, respectively) target the soma. (c,d) Schematics of configurations for synaptic stimulation of EPSPs (F-stim) while simulating IPSPs (G-inject) with conductance-clamp (G-clamp, c) and simulating both EPSPs and IPSPs with conductance-clamp (d). (e) Timing convention. The onset of Inhibition is timed relative to that of Excitation from one side (Δtinh), designated as contralateral. Negative values indicate Inhibition leads Excitation (Inh-lead), and positive values indicate Inhibition lags Excitation (Inh-lag). (f,g) Voltage traces for an example recording using configurations in c,d, respectively, aligned in time to the peak of the EPSP alone (light traces). The influence of a precisely timed IPSP (red traces) on EPSP peak timing is visualized as a shifted peak of the composite PSP (dark traces). Traces are separated to illustrate inhibitory timing conditions that enforced a peak advance (left) or delay (right). Traces are also plotted aligned in time to the IPSP in Supplementary Fig. 2e. Resting membrane potential (Vrest): −64 mV. (h) Average (±s.e.m.) EPSP peak shifts plotted against Δtinh for synaptically evoked (blue) and conductance-clamp-simulated (black) EPSPs. Negative and positive values indicate an EPSP peak advance and delay, respectively. Δtinh=0.1 ms, P=0.986; Δtinh=−0.6 ms, P=0.647; two-way ANOVA, n=7 recordings.

