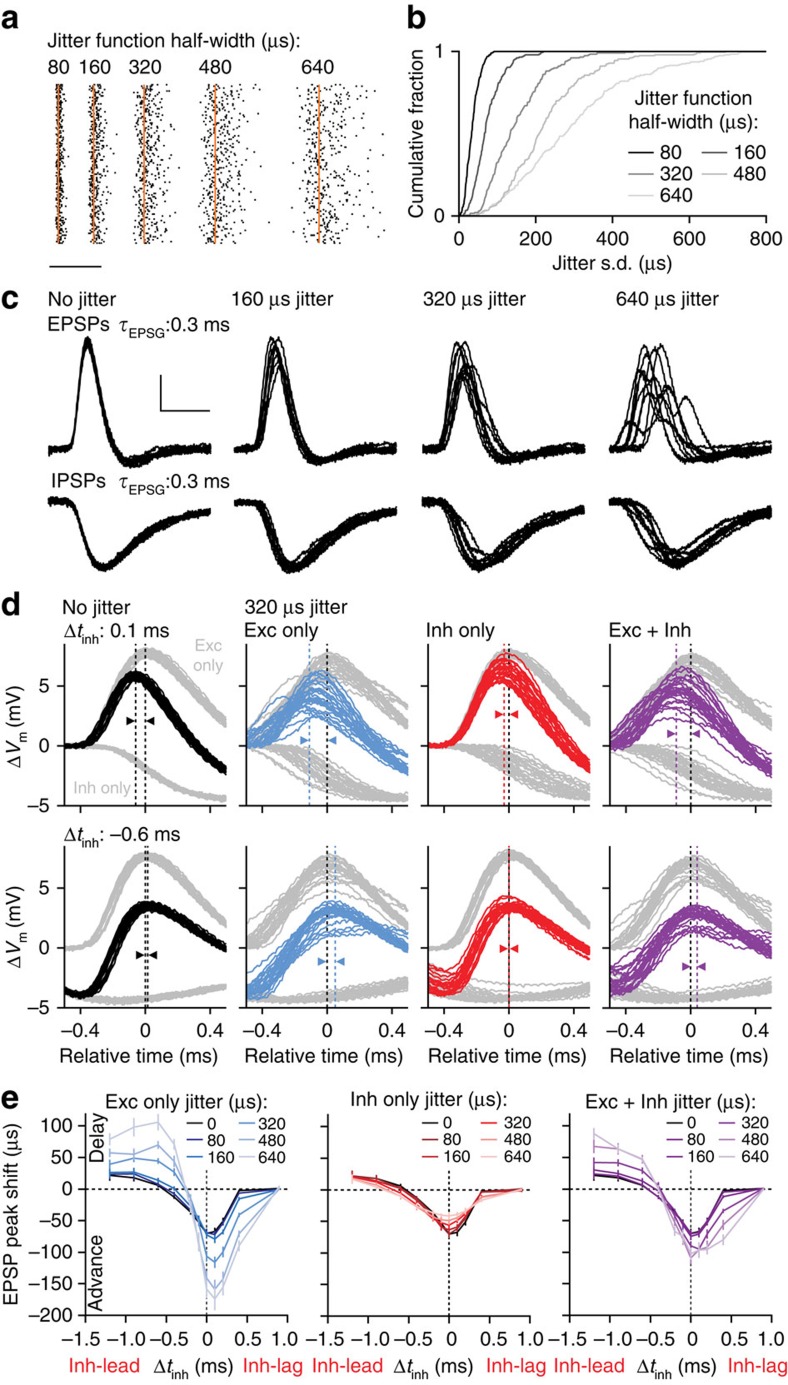
Figure 5. Synaptic jitter enhances peak shifts.
(a) Raster plots showing 100 trials of four event onset times jittered with gamma distributions of increasing function half-widths (left to right). Orange line indicates the reference time point (no jitter). Scale bar, 1 ms. (b) Cumulative histogram of the onset timing s.d. for the four jittered events. (c) Ten overlaid voltage traces for an example recording of the resulting composite EPSPs (top) and IPSPs (bottom) generated by jitter functions of increasing half-widths (left to right). Vrest: −64 mV. Scale bar, 2 mV, 1 ms. (d) Voltage traces of 25 trials from the recording in c (from left to right) without jitter, or the 320 μs half-width jitter function applied to excitation (Exc) only, inhibition (Inh) only, or Exc and Inh. Inhibitory timing conditions that advanced (Δtinh=0.1 ms, top) and delayed (Δtinh=−0.6 ms, bottom) EPSP peak timing are shown. Grey traces show EPSPs and IPSPs alone, and dark traces show composite PSPs, aligned in time to the peak of the EPSP alone for each trial. Dotted vertical lines and arrow heads indicate the average peak shift of all 100 trials in the recording. (e) Average (±s.e.m.) EPSP peak shifts plotted against Δtinh for each jitter function applied to Exc only (left), Inh only (centre) and Exc plus Inh (right). Without jitter, EPSP peak shifts were similar to those in Fig. 1h. Compared with no jitter conditions, introducing EPSP jitter (320 μs jitter function half-width) increased peak shifts to ~200% (Δtinh=0.1 ms, P<0.001; Δtinh=−0.6 ms, P=0.002), and introducing IPSP jitter reduced peak shifts to ~75% (Δtinh=0.1 ms, P=0.023; Δtinh=−0.6 ms, P=0.344). Introducing EPSP plus IPSP jitter increased peak shifts to ~150% (Δtinh=0.1 ms, P=0.014; Δtinh=−0.6 ms, P=0.047). Two-way ANOVA, n=6 recordings.

