
Figure 3.
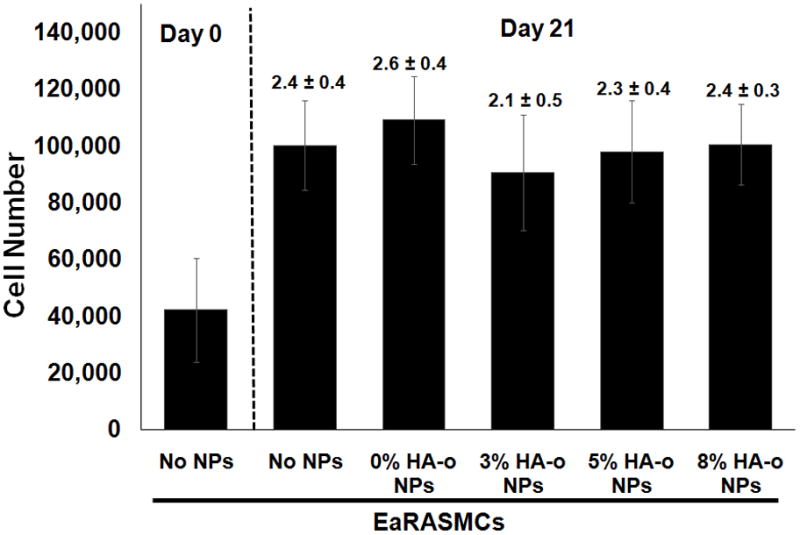
Proliferation data for EaRASMCs in response to HA-o released from PVA-NPs at three different HA-o loadings (3%, 5%, and 8%). The NP concentration in all cases was 0.5 mg/mL. Values above error bars indicate fold increases in mean ± SD of cell numbers vs. day 1 of the culture experiment. EaRASMCs cultured standalone served as the treatment control and cells cultured with blank NPs (0% w/w DOX) were regarded as the active agent control. The cell number was calculated based on an estimate of 6 pg of DNA per cell, via a DNA assay, at 1 and 21 days post-seeding (All values are mean ± SD; n = 3 per case).