
Figure 5.
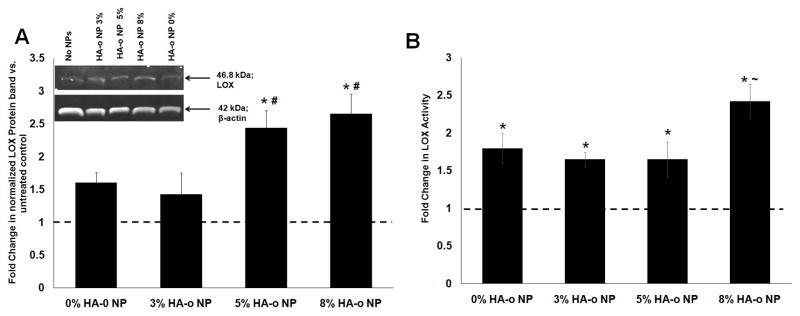
Effects of PVA-NPs and HA-o released from NPs on LOX (A) protein synthesis and (B) enzymatic activity. (A) Fold change in LOX protein synthesis by EaRASMC cultures treated with HA-o loaded (0, 3, 5 and 8% w/w) PLGA NPs relative to NP-untreated EaRASMC controls. LOX band intensity for each sample was normalized to intensity of the corresponding β-actin band and then further normalized to similarly calculated values for the control cultures. Inset: representative image of a western blot illustrating the expression of LOX protein, along with β-actin bands as loading controls. (B) Fold-change in LOX activity at 21 days in EaRASMC cultures treated with NPs containing different levels of HA-o loading. LOX activity was measured in the cell layer by the quantity of hydrogen peroxide released upon oxidative deamination of alkyl monoamines and diamines, normalized to that of the NP-untreated controls. * denotes p < 0.05 compared to EaRASMCs; # denotes p < 0.05 compared to 0 and 3% HA-o loaded NPs; ~ denotes p < 0.05 compared to 0, 3, and 5% HA-o loaded NPs. (Data represented as mean ± SD; n = 3 per case for Western blots, n = 6 per case for LOX activity assay; * denotes p < 0.05 compared to controls with no NPs). The normalized band intensity of LOX for the NP-untreated control test condition was set to unity to determine the fold change in LOX expression or activity for the different NP-treated test cases.