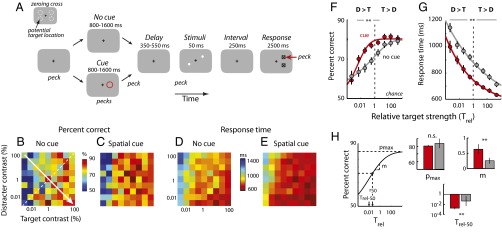
Fig. 1.

Top-down spatial cueing improves target localization in a filtering task. (A) The sequence of events in a target localization task with a task-relevant distracter and interleaved spatial cues (see Target Localization in the Presence of a Task-Relevant Distracter for description). The black + is the zeroing cross, the red circle is the cue, white dots are the target and distracter, squares with an inlaid X are the response boxes, and the red arrow is the peck to the response box. (Inset) Dashed circles are the potential target locations (not actually presented on the screen). (B) Percent correct as a function of distracter and target strengths (contrasts) for localization performance without a cue (n = 199 experimental sessions in three birds). Target and distracter contrasts were randomly and independently sampled from one of nine values (0.0033–100%, uniformly spaced on a logarithmic scale). Hotter colors indicate higher percent correct. The dashed white line is the line of equal target and distracter strengths. The arrow indicates the axis of increasing relative target strengths. (C) Same as in B, but with a spatial cue. (D) Response times as a function of distracter and target strengths for correctly localized targets, without a cue. Hotter colors indicate shorter (faster) response times. Other conventions are as in A. (E) Same as in D, but with a spatial cue. (F) Psychometric functions of percent correct, without and with a spatial cue, as a function of relative target strength (Trel, defined as the target-to-distracter contrast ratio). The strength of the target relative to that of the distracter, plotted on a logarithmic scale, increases from left to right (direction of the arrow in B). Gray data represent uncued performance and red data represent cued performance. The dashed vertical line represents equal target and distracter strengths (Trel = 1). Curves represent cumulative Gaussian fits. Error bars represent SEM (jack-knife). (G) Psychometric functions of response times without and with a spatial cue, for correctly localized targets, as a function of relative target strength (population data). Lines represent power law fits (Pieron’s law). Other conventions are the same as in F. (H, Left) Schematic showing parameters estimated from cumulative Gaussian fits to psychometric functions of percent correct (shown in F). pmax is the asymptotic performance, m is the slope, Trel-50 is the value of Trel at which performance reached half of its maximum value (above chance), r50 is the value of Trel at which performance reached half of its range. (H, Right) pmax, m, and Trel-50 estimates from psychometric functions of uncued (gray) and cued (red) performance. Error bars represent SEM (jack-knife). (F–H) Significant differences are indicated by a double asterisk (**P < 0.01 level, bootstrap test with Bonferroni correction for multiple comparisons); n.s., not significant.
