
Fig. 2.
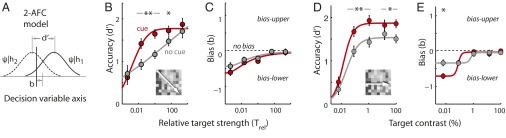
Spatial cueing effects on perceptual localization accuracy (d′) and bias (b). (A) A 2-AFC signal detection model incorporating bias. The solid line is the decision variable (ψ) distribution for a stimulus at the upper location (location 1, ψ|h1). The dashed line is the ψ distribution for a stimulus at the lower location (location 2, ψ|h2). As with conventional SDT, the distributions are assumed to be unit normal (Gaussian with unit variance). Localization accuracy, d′, the distance between the means of the two distributions, measures their mutual overlap. Bias, b, represents a criterion (cutoff value for the decision variable) based on which the animal decides to report an upper (ψ > b) vs. lower (ψ < b) target. (B) Psychometric functions of localization accuracy (d′) as a function of relative target strength for performance without (gray) and with (red) the cue (population data). Data averaged across equivalent target-to-distracter contrast ratios (diagonal entries of the performance matrix, Fig. 1 B and C). (Inset) The arrow indicates the axis of increasing Trel. Curves represent cumulative Gaussian fits. Other conventions are the same as in Fig. 1F. (C) Bias, b, as a function of relative target strength without (gray) and with (red) the cue. Positive values indicate a bias toward the upper response boxes and negative values toward the lower. Curves represent sigmoid fits. Other conventions are the same as in B. (D) Psychometric functions of localization accuracy (d′) as a function of absolute target contrast for performance without (gray) and with (red) the cue. Data averaged across distracter contrasts (columns of the performance matrix, Fig. 1 B and C). (Inset) The arrow indicates the axis of increasing target contrast. Curves represent Naka–Rushton fits. Other conventions are the same as in B. (E) Bias, b, as a function of absolute target contrast without (gray) and with (red) the cue. Other conventions are the same as in C and D. (B–E) Significant differences are indicated by a single asterisk (*P < 0.05) or double asterisk (**P < 0.01 level, bootstrap test with Bonferroni correction for multiple comparisons).