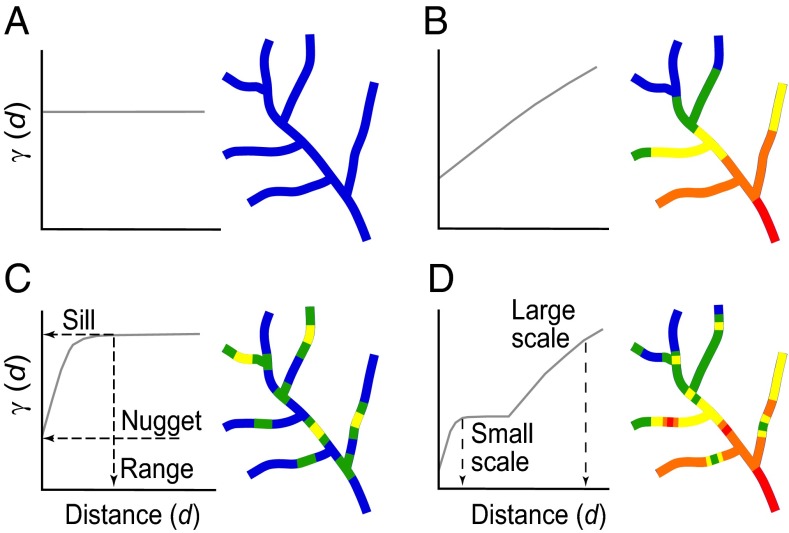
Fig. 1.
Hypothetical semivariograms and associated maps depicting representative spatial patterns of water chemistry in a stream network. Nonstructured spatial pattern (i.e., uniform or random) (A) is indicated in the semivariogram by no change in semivariance (γ) (y axis) with increasing distance (d) between neighbors (x axis), as is graphically depicted by the uniform line color in the associated network map. In the example shown (A), γ = 0 for a uniform, nonstructured spatial pattern. Other potential semivariograms and associated network patterns include spatial dependence at a broad-scale with a gradient symbolized in the network map by changes in line color from the upper left (blue) to the lower right (red) of the stream network (B), fine-scale patchiness or spatial dependence indicated in the network map as ”hotspots” (C), and nested heterogeneity reflecting a combination of fine-scale patchiness imbedded within a broad-scale gradient (D) (in the sense of ref. 26). Characteristics of the semivariogram (C) are the asymptote or “sill,” which is roughly equivalent to the total population variance; the variance discontinuity at the y intercept or “nugget,” which represents variance due to sampling error and/or spatial dependence at distance intervals not explicitly sampled; and the “range,” which defines the distance or scale over which spatial dependence is expressed. Beyond this range, in a nonnested structure, points are spatially independent of one another or uncorrelated. Nested semivariograms are hierarchical structures, each characterized by its own range.

