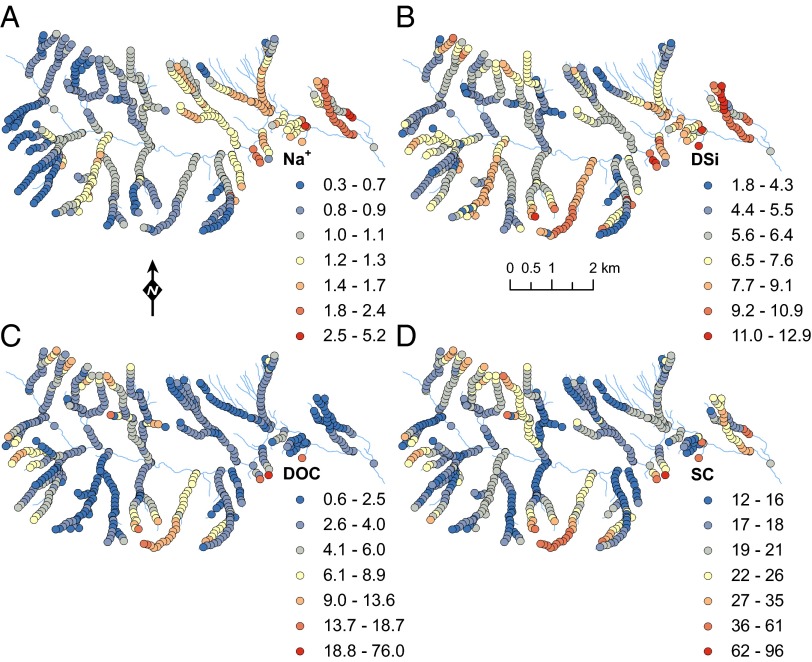
Fig. 2.
Spatial patterns of sodium (Na+; mg/L) (A), dissolved silica (DSi; reported as SiO2 mg/L) (B), dissolved organic carbon (DOC; mg/L) (C), and specific conductance (SC; μS/cm) (D) derived from sampling streamwater chemistry at 664 locations throughout the Hubbard Brook Valley, NH, during October–December 2001.

