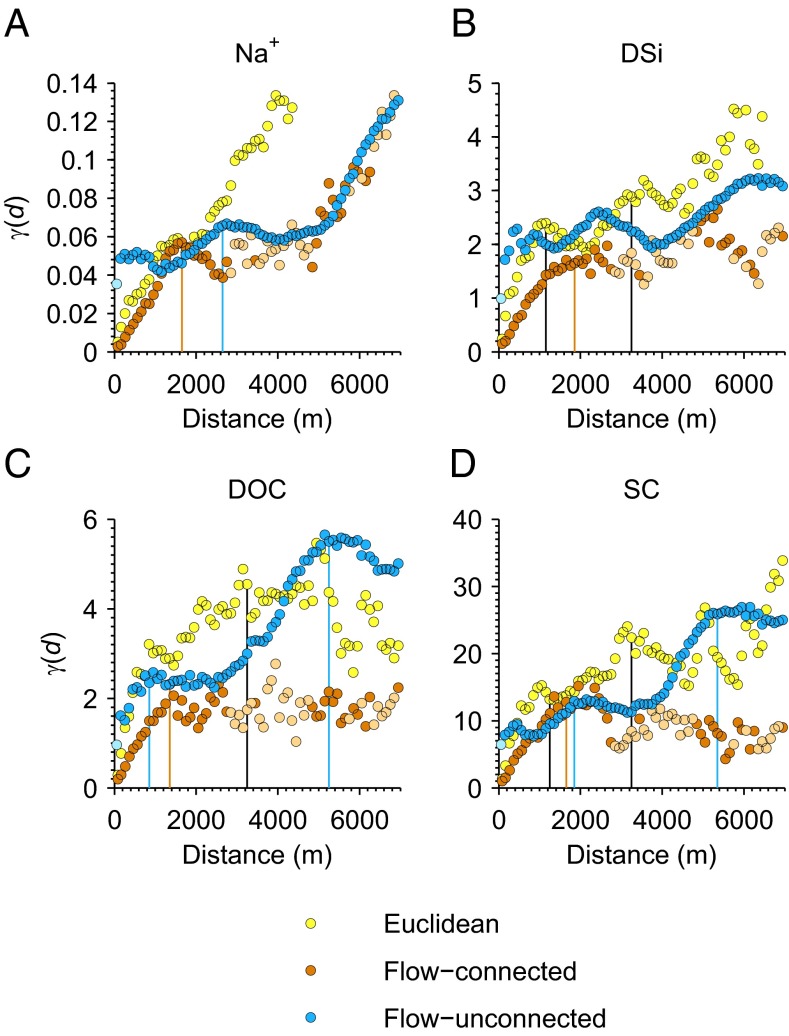
Fig. 3.
Empirical semivariograms for sodium (Na+; mg/L) (A), dissolved silica (DSi; reported as SiO2 mg/L) (B), dissolved organic carbon (DOC; mg/L) (C), and specific conductance (SC; μS/cm) (D) based on Euclidian, flow-connected, and flow-unconnected spatial relationships (d) in the Hubbard Brook Valley. Visually estimated ranges (Table 1) for Euclidean (E) (yellow and black line), flow-connected (FC) (orange), and flow-unconnected (FU) (blue) relationships are indicated with vertical lines. Symbols with lighter color shades indicate semivariance estimates based on <100 pairs of points.

