Fig. 4.
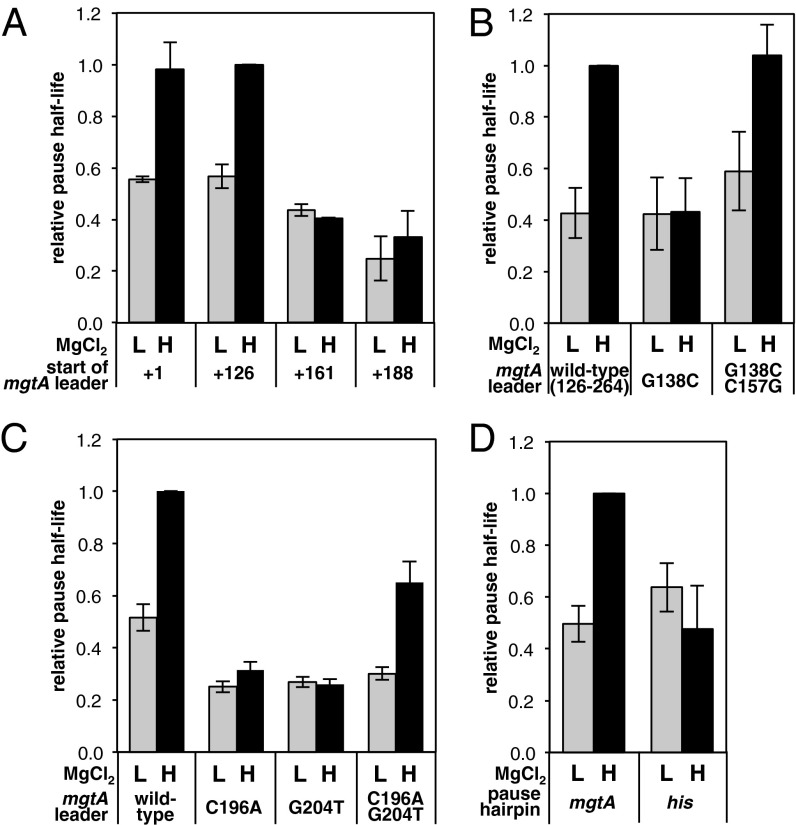
RNA sequences in the mgtA leader are required for long, Mg2+-sensitive pausing. (A) Relative half-life of the T218 pause measured after in vitro transcription of DNA templates containing nucleotides 1–264, 126–264, 161–264, or 188–264 of the mgtA leader at low (L, 0.35 mM) or high (H, 3.5 mM) MgCl2. The half-lives were normalized to the half-life measured using the nucleotide 126–264 template at high Mg2+. Data are averages from at least three independent experiments, and error bars show the SD. A representative gel from these experiments is shown in Fig. S1A. (B) Relative half-life of the T218 pause measured after in vitro transcription of DNA templates containing nucleotides 126–264 of either the WT mgtA leader or the mgtA leader harboring the indicated substitutions in stem-loop B at low (0.35 mM) or high (3.5 mM) MgCl2. Pause half-lives were normalized to the half-life measured using the WT template at high Mg2+. Data are averages from at least three independent experiments, and error bars show the SD. A representative gel from these experiments is shown in Fig. S1B. (C) Relative half-life of the T218 pause measured after in vitro transcription of DNA templates containing either the full-length WT mgtA leader or derivatives harboring the indicated substitutions in hairpin P, at low (0.35 mM) or high (3.5 mM) MgCl2. Pause half-lives were normalized to the half-life measured using the WT template at high Mg2+. Data are averages from three independent experiments, and error bars show the SD. A representative gel from these experiments is shown in Fig. S1C. (D) Relative half-life of the T218 pause measured after in vitro transcription of DNA templates containing nucleotides 126–264 of either the WT mgtA leader or a derivative in which hairpin P was replaced with the corresponding hairpin from the his pause. Pause half-lives were normalized to the half-life measured using the WT template at high Mg2+. Data are averages from three independent experiments, and error bars show the SD. A representative gel from these experiments is shown in Fig. S1D.

