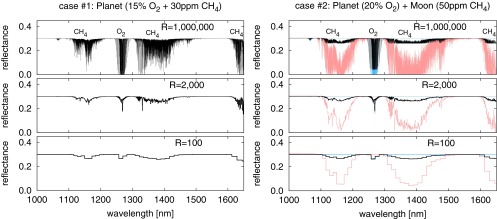
Fig. 1.

Model spectra for cases 1 and 2 with varying resolution. (Left) Model spectra of a planet with 15% O2 and 30 ppm CH4 (case 1). (Right) Black lines show combined spectra of a planet with 20% O2 and a moon with 50 ppm CH4. Blue lines show model spectra of a planet with 20% O2. Red lines show model spectra of a moon with 50 ppm CH4.
