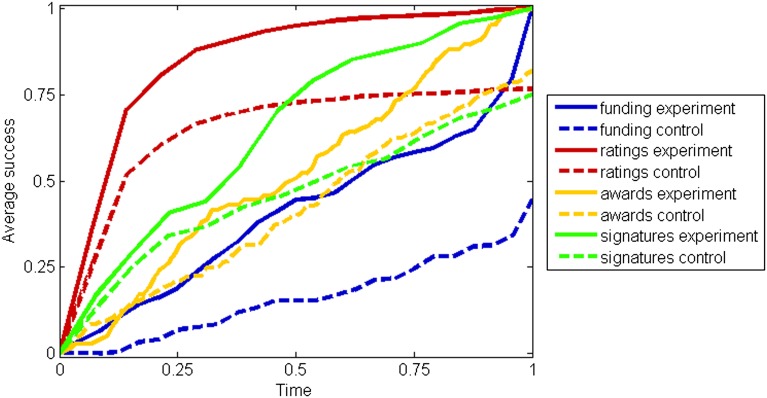
Fig. 2.
The success-breeds-success effect over time. The curves represent running numbers of donations (blue), positive ratings (red), awards (yellow), and campaign signatures (green) in the experimental condition (solid lines) and the control condition (dashed lines). The horizontal axis is normalized so that 0 marks the time of experimental intervention, and 1 marks the end of the observation period. The vertical axis is normalized so that for each system a value of 1 equals the maximum across time and conditions.

