Fig. 1.
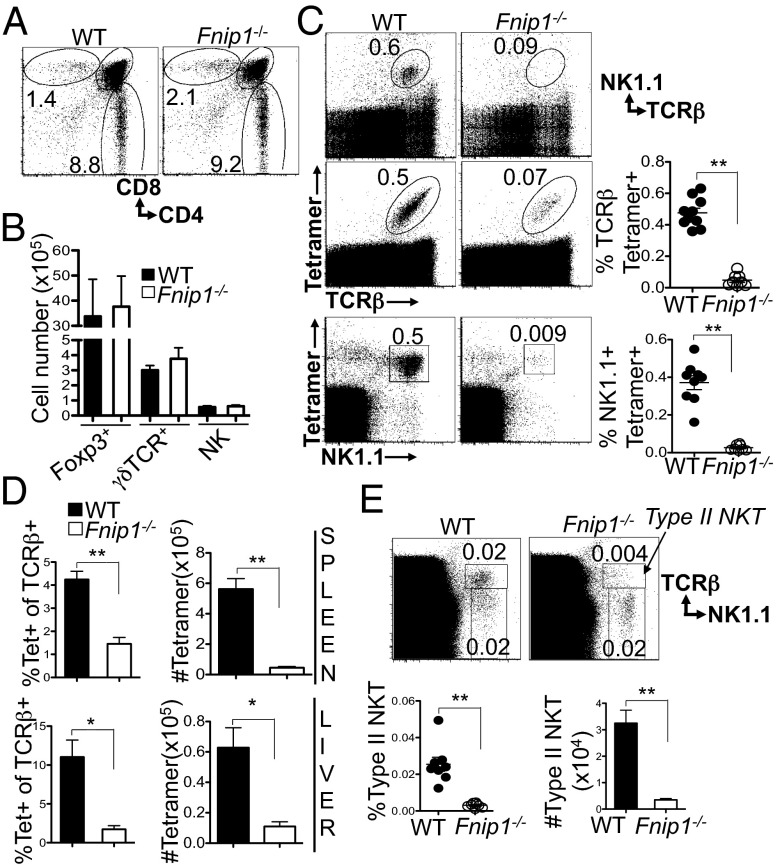
Fnip1-null mice display normal T and NK cell development but disrupted iNKT development. (A and B) Thymocytes were stained for CD4, CD8, Foxp3, NK1.1, TCR-γδ, and TCR-β. Shown are the percentages of cells within specified gates: (A) a representative from n = 8 mice per group; (B) T-cell subsets, n = 4 mice per group for Foxp3 and 6 mice per group for γδ TCR), NK cell number (n = 15 mice/group). Shown are the mean ± SEM. (C) The percentage of CD1d tetramer-positive or NK1.1+ cells within TCR-β+ thymocytes is greatly decreased in Fnip1−/− thymocytes. Shown are the means ± SEM of eight to nine mice per group. (D) Peripheral iNKT cell numbers are decreased in Fnip1−/− mice. Cells isolated from spleen or liver were stained for TCR-β and CD1d tetramer. Shown are the mean ± SEM of six to nine mice per group. (E) The percentage of type II NKT cells within TCR-β+ thymocytes is greatly decreased in Fnip1−/− thymocytes. Cells stained with TCR-β, CD1d tetramer, and NK1.1 type II NKT cells are shown among CD1d tetramer-negative cells. Shown are the mean ± SEM of eight mice per group. *P < 0.05 (unpaired t test), **P < 0.0001 (unpaired t test).

