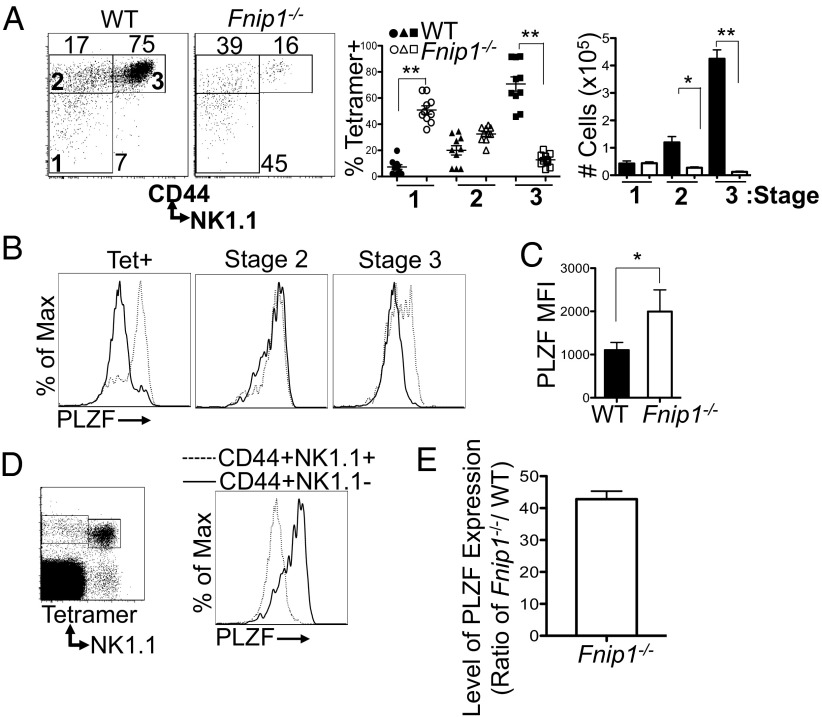
Fig. 2.
Loss of Fnip1 results in a block in iNKT cell development at Stage 2. (A) Thymocytes from WT and Fnip1−/− mice were stained for CD44, NK1.1, TCR-β, and CD1d tetramer. CD44 and NK1.1 expression profiles within tetramer-positive cells were analyzed and the percentage and cell number of stage 1 (CD44−NK1.1−), stage 2 (CD44+NK1.1−), and stage 3 (CD44+NK1.1+) iNKT cells are shown. Mean ± SEM of 10 mice per group is shown. (B and C) Thymic Fnip1−/− tetramer-positive iNKT cells (dashed line) express high levels of PLZF relative to WT iNKT cells (solid line). Mean fluorescence intensity (MFI) is shown on NK1.1+ cells within tetramer-positive cells (C). Mean ± SEM is shown from n = 7 mice per group. (D) PLZF expression is down-regulated at the transition from stage 2 to stage 3. WT thymocytes were stained with CD1d tetramer and antibodies specific for NK1.1 and CD44. After fixation and permeabilization, cells were stained with antibody specific for PLZF (representative of n = 7 mice per group). (E) PLZF transcript is highly elevated in stage 3 Fnip1−/− iNKT cells compared with WT. WT and Fnip1−/− NK1.1+CD44+ cells were FACS-sorted and PLZF transcript was analyzed by real-time PCR. Shown is the mean PLZF expression (± SEM) of three mice per group. *P < 0.05 (unpaired t test), **P < 0.0001 (unpaired t test).

