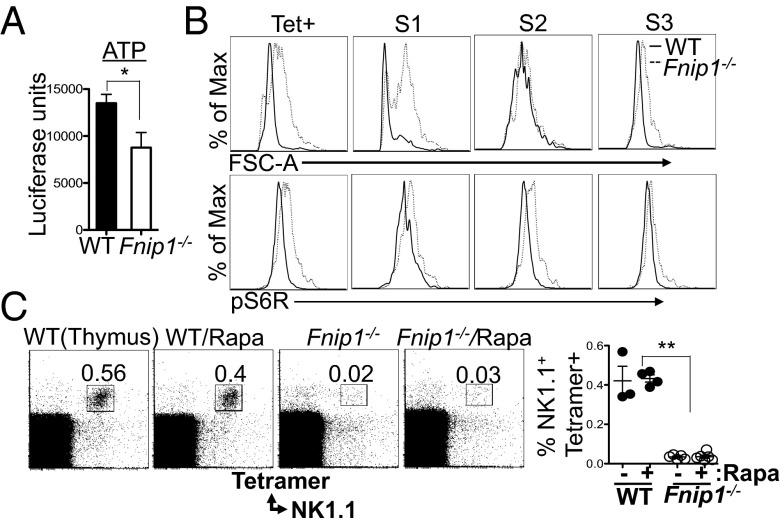
Fig. 6.
iNKT cells from Fnip1−/− mice have reduced ATP levels, are larger in size, and exhibit hyperactive mTOR signaling. (A) ATP levels were determined on sorted stage 1 iNKT cells (NK1.1−CD44−) from WT and Fnip1−/− mice using a luciferase assay. Shown is the mean ± SEM of five mice per group. *P < 0.05 (paired t test). (B) Fnip1−/− iNKT cells are larger and contain increased phospho-S6 ribosomal protein (pS6R). Shown are representative flow cytometric histograms of six mice per group. (C) WT and Fnip1−/− mice were fed a rapamycin-supplemented diet for 50 d and thymocytes were stained with the indicated reagents. The percentage of NK1.1+ CD1d tetramer-positive cells is graphed. Shown is the mean ± SEM of three to six mice per group. **P < 0.0001 (unpaired t test).

