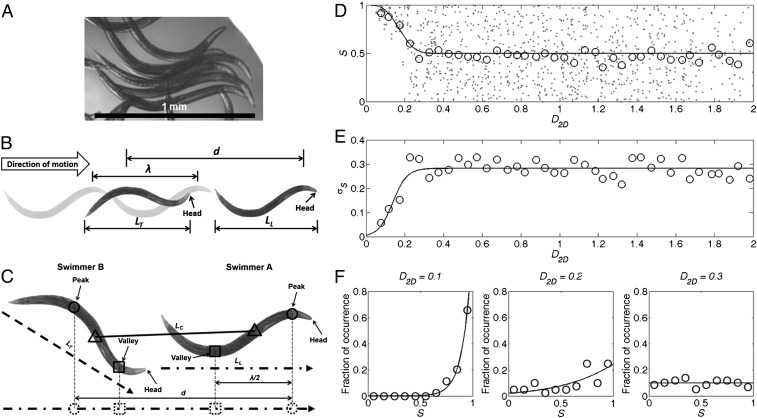
Fig. 1.
Synchronization in a swarm of animals. (A) When in a swarm, clusters of wild-type C. elegans synchronize their gait. (B) A schematic defining synchronization between collinear swimmers. Both swimmers are depicted in dark shades. The extrapolated wave pattern of the lead swimmer is in light shades. LT and LL denote the axial lengths of the trailing and leading animals, respectively; and λ denotes the wavelength of the leading animal and d denotes the horizontal distance between the peaks of the leading and trailing animals. (C) Extension of the definition of synchronization to noncollinear swimmers. The dashed and dash–dotted arrows represent the direction of motion of each swimmer. LC denotes the distance between midpoints of each swimmer’s peak and valley. (D) The synchronization (S) as a function of the normalized interswimmer distance (D2D). The dots correspond to data for individual pairs. The open circles correspond to the average values of S. (E) The SD of synchronization (open circles) as a function of D2D. (F) The probability distribution (circles, n = 3 experiments) of S when D2D = 0.1 ± 0.05 (Left), 0.2 ± 0.05 (Center), and 0.3 ± 0.05 (Right). The solid lines are fitted curves to guide the eye.

