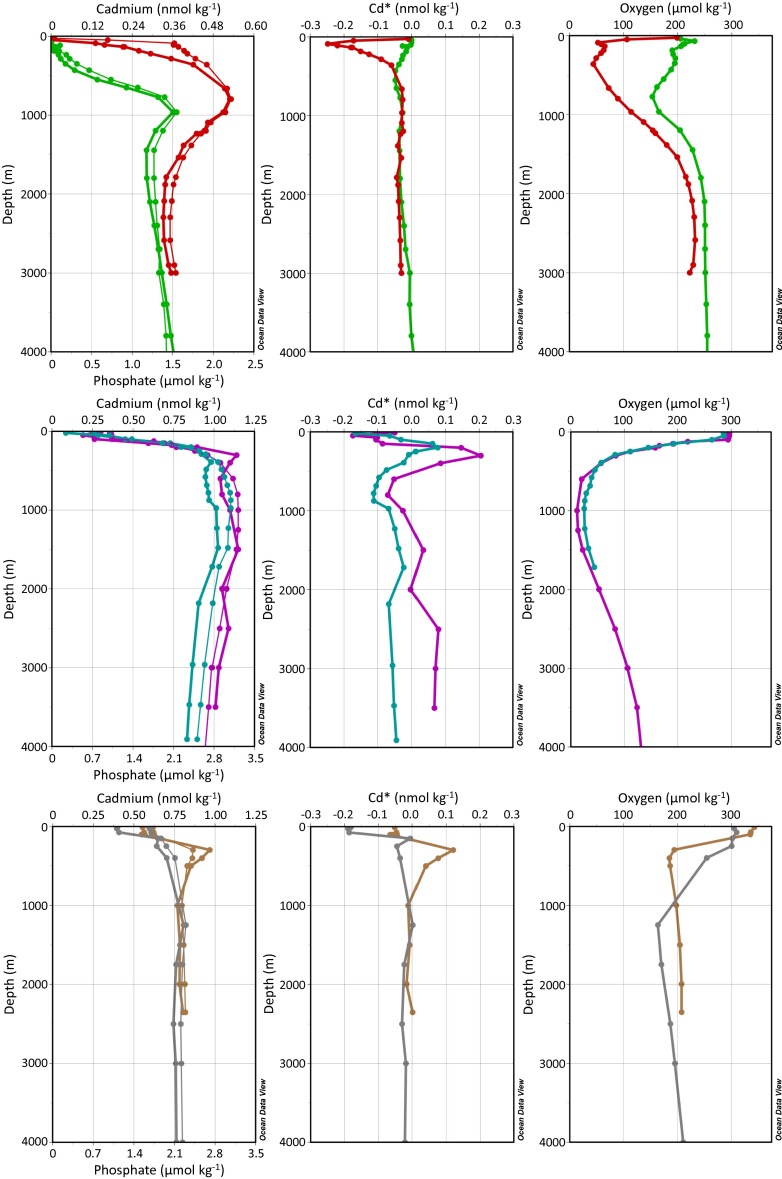
Fig. 2.
Water column profiles of dissolved oxygen, cadmium, and phosphate concentrations in the North Atlantic, Pacific, and Southern Oceans together with calculated Cd* for each location. (Top) Atlantic data; (Middle) Pacific data, and (Bottom) Southern Ocean–subantarctic data. Trace metal concentrations are shown in thick lines and macronutrients in thin lines, and colors correspond to station locations and studies in Fig. 1.

