Fig. 5.
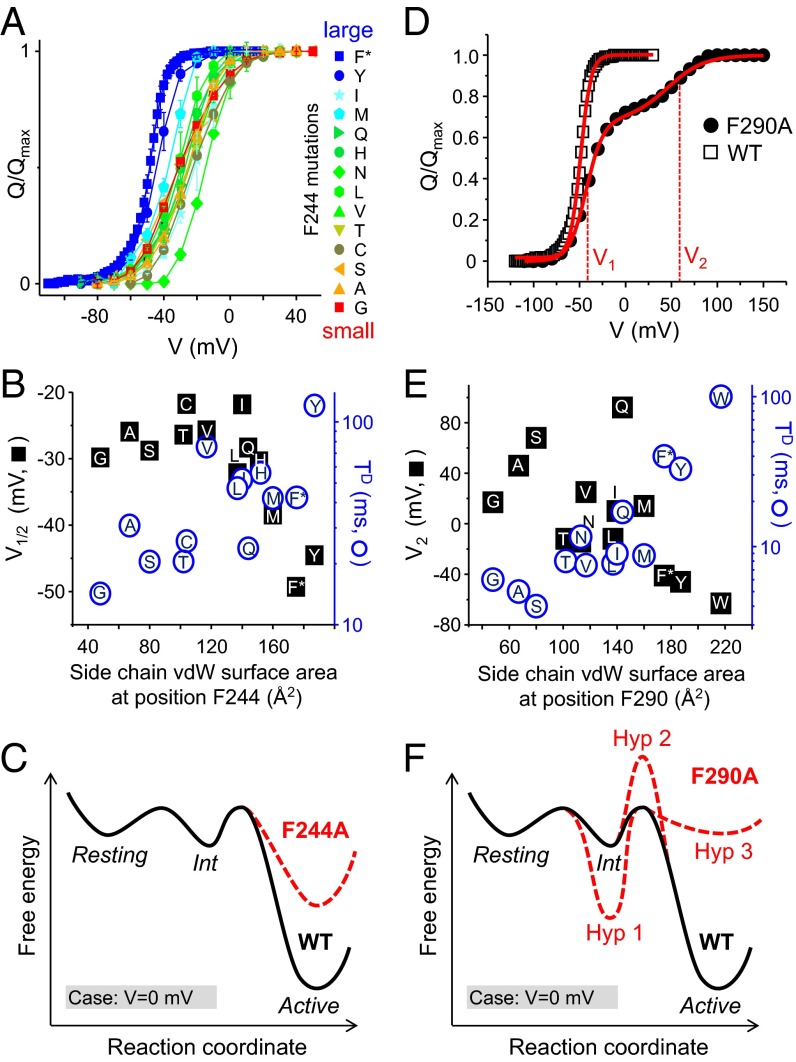
Large side chains at positions F244 and F290 stabilize the activated state of the VSD. (A) Q–V curves for the F244 mutants colored from red to blue as the size of the substituted side chain increases. (B) Plots showing the mean V1/2 (black squares) and TD (blue circles) values as a function of the surface area of the substituted side chain at position F244. Letters indicate the substituted amino acid. (C) Hypothetical three-state energy landscape (V = 0 mV) illustrating the effect of the F244A mutation (red dotted line) relative to the WT channel (black line). (D) Q–V curves for the WT Shaker (black squares) and the F290A mutant (red circles) taken from a previous study (38). The Q–V curve for the F290A displays two components with distinct midpoint voltages V1 and V2. (E) The mean V2 values (black squares) and TD values (blue circles) plotted as a function of the surface area of the substituted side chain at position F290. (F) The hypothetical three-state energy landscape (V = 0 mV) for WT (black line) is shown with three alterations (Hyp-1 to -3, red dotted lines), which could explain the split of the Q–V curve imparted by the F290A mutation (see text).

