Fig. 7.
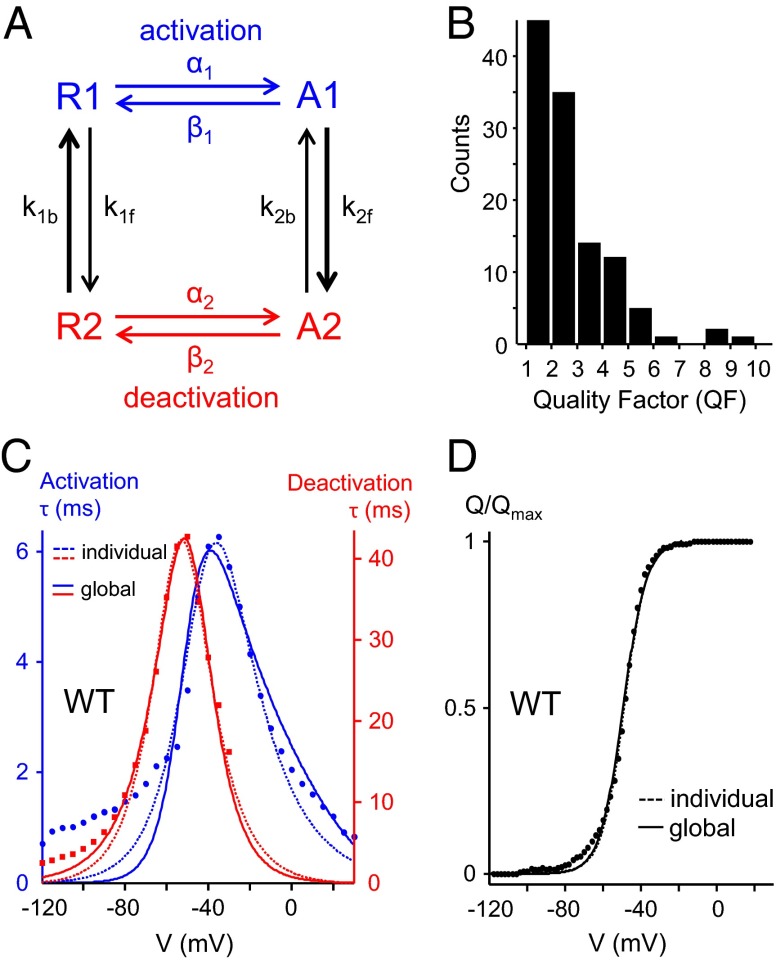
Kinetic modeling. (A) Schematic representation of our 2 × 2-state kinetic model. Activation (blue) and deactivation (red) are produced in two parallel pathways to account for the slowing down of deactivation kinetics. (B) Distribution of global fit quality factor (QF) values for all tested mutants (SI Text). (C) Comparison of individual (dotted lines) and global fits (solid lines) for the activation (blue traces) and deactivation (red traces) τ–V curves obtained for WT Shaker. (D) Comparison of individual (dotted lines) and global fits (solid lines) of the Q–V curve obtained for WT Shaker.

