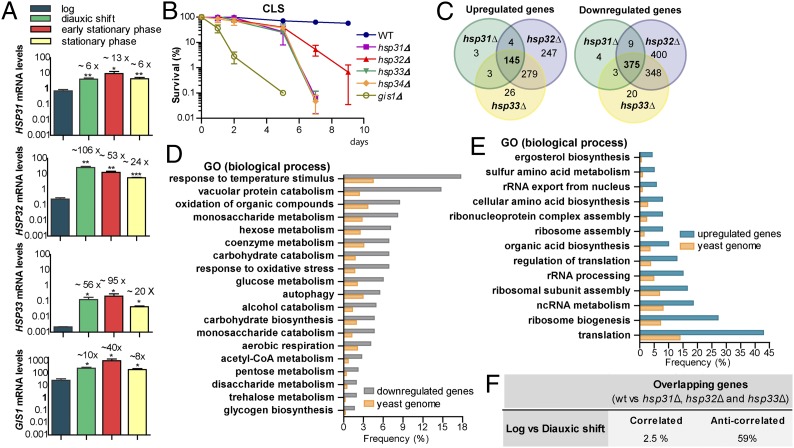
Fig. 1.
HSP31, HSP32, and HSP33 are required for normal DS and CLS. (A) Gene-expression quantification was performed via qRT-PCR in midlog, DS, early SP (1 d growth) and SP (2 d growth) and normalized by TAF10 and UBC6. Error bars represent SD (SD) of the mean (n = 3). Fold-induction is indicated on top of each bar. Statistical analyses were performed using Student t test (***P < 0.001, **P < 0.01, *P < 0.05). (B) Strains were monitored for CLS by counting colony-forming units. Day 0 is the time when cultures reached SP (survival = 100%). Mean and SD (n = 3) are indicated in the graph. (C–F) Expression analysis of hsp31Δ, hsp32Δ, and hsp33Δ at DS. (C) Overlap between up- or down-regulated genes in hsp31Δ, hsp32Δ, and hsp33Δ versus WT cells. (D and E) Overlapping genes were grouped in terms of GO. The most significant gene clusters are shown. Frequency is the percentage of overlapping genes that are clustered in a given ontology group; the yeast genome frequency is the total percentage of genes annotated for that term in the parental strain. (F) Log and DS expression profiles were downloaded from ArrayExpress (E-TABM-496) and subsequently analyzed to calculate the fold-change between these two conditions. DEGs > twofold (P < 0.05) were divided in up- and down-regulated groups and were compared with the overlapping genes obtained in C.

