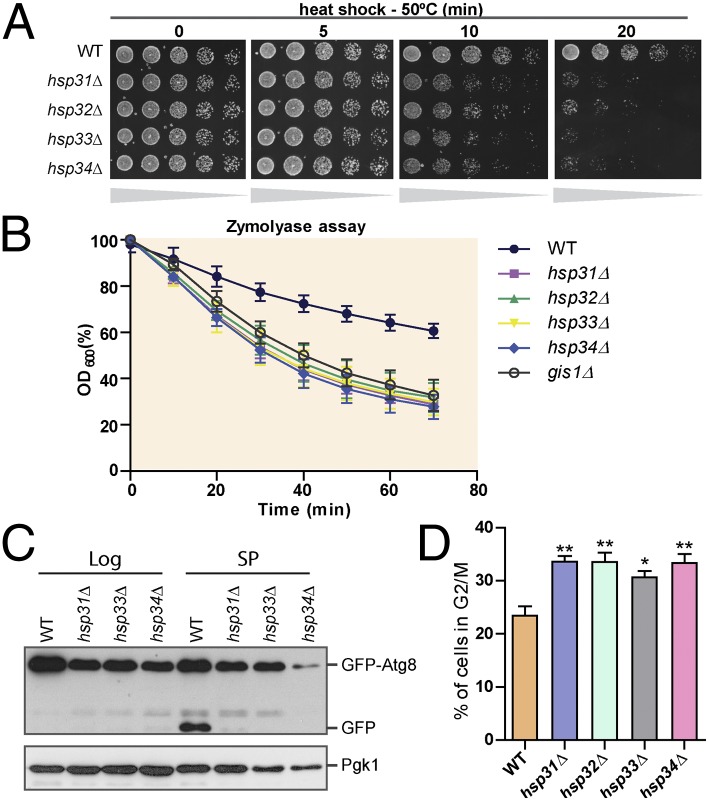
Fig. 2.
hsp31Δ, hsp32Δ, hsp33Δ, and hsp34Δ cells fail to acquire typical SP characteristics. WT and gene-deletion strains were analyzed for resistance to heat stress (A), cell wall integrity (B), autophagy flux (C), and cell cycle (D). (A) Cultures were grown until SP (2 d growth) and subjected to a 50 °C heat shock for the specified time. (B) SP cultures were incubated with zymolyase cell lysis was measured by reading the OD600. (C) Log and SP cells expressing GFP-Atg8 were lysed and analyzed by immunoblotting. The presence of free GFP is an indicator of autophagic flux. (D) To quantify DNA content, cells were stained with propidium iodide and analyzed by flow cytometry. The graph represents the percentage of cells remaining in G2/M during SP. Error bars represent SD of the mean for each assay (n = 3, Student t test, **P < 0.01, *P < 0.05).

