
Figure 1.
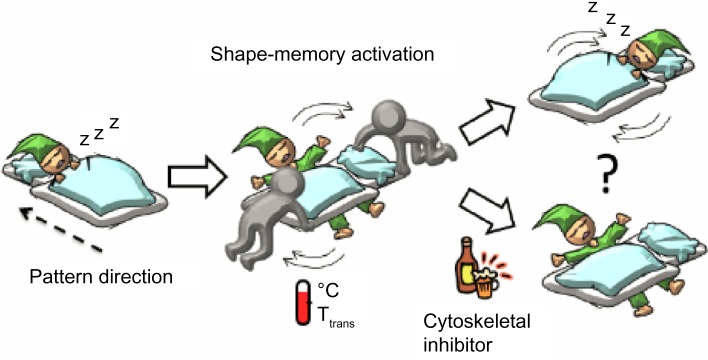
A schematic representation of cell response to the surrounding environmental changes.
Note: The figure illustrates how an aligned and elongated cell changes its morphology when the direction of surface patterns suddenly changes.
Abbreviation: Ttrans, transition temperature.