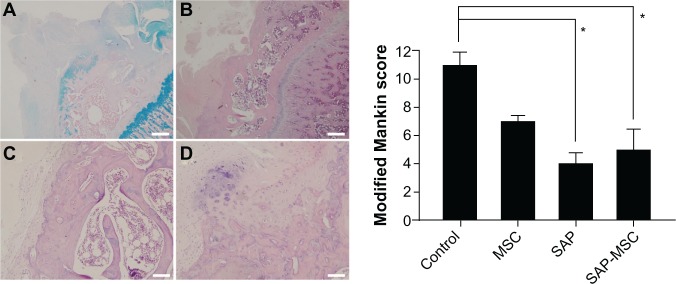
Figure 6.

(A–D) Representative figures (magnification ratio 200×) are presented, and modified Mankin scores in the control (n=5), MSC (n=6), SAP (n=6), and SAP-MSC (n=6) groups are shown as means ± standard error of mean.
Notes: The scores in the SAP and SAP-MSC groups were significantly lower than that in the control group. From the left upper quadrant, figures show reduction in Alcian blue staining (A), destroyed cartilage structures (B), destroyed tidemark (C), and clusters of cartilage cells (D). Scale bar 50 μm. *P-value is less than 0.05.
Abbreviations: MSC, mesenchymal stem cell; SAP, self-assembled peptide.
