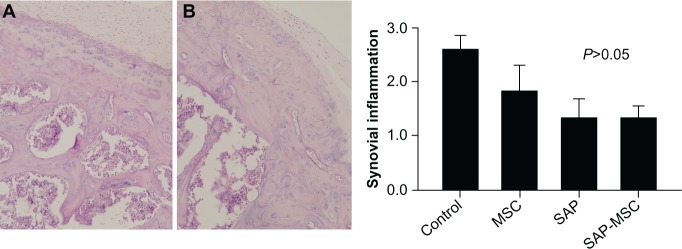
Figure 7.

Representative figures (magnification ratio 200×) were presented for thickened synovial membrane infiltration of inflammatory cells in the control group (A) and reduced changes in the SAP-MSC group (B). Synovial inflammation scores in the control (n=5), MSC (n=6), SAP (n=6), and SAP-MSC (n=6) groups are shown as means ± standard error of mean.
Abbreviations: MSC, mesenchymal stem cell; SAP, self-assembled peptide.
