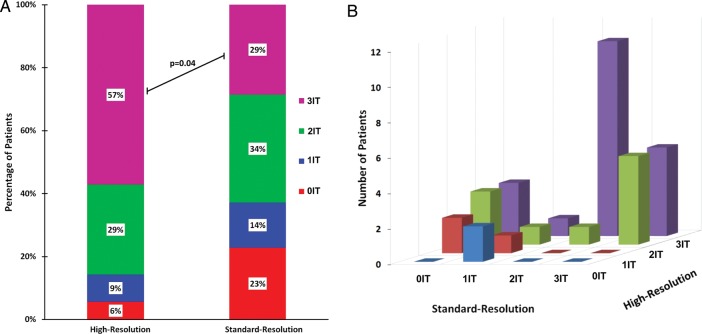
Figure 2.
Distribution of ischaemia detected by perfusion CMR. (A) In patients with 3VD (n = 35), hypoperfusion in all three territories was detected in 57% using high-resolution imaging but in only 29% using standard-resolution (P = 0.04). (B) There was also poor agreement between high-resolution and standard-resolution imaging in determining the distribution of ischaemia in patients with 3VD (kappa = 0.09, 95% CI: −0.10–0.29). IT = ischaemic territories.

