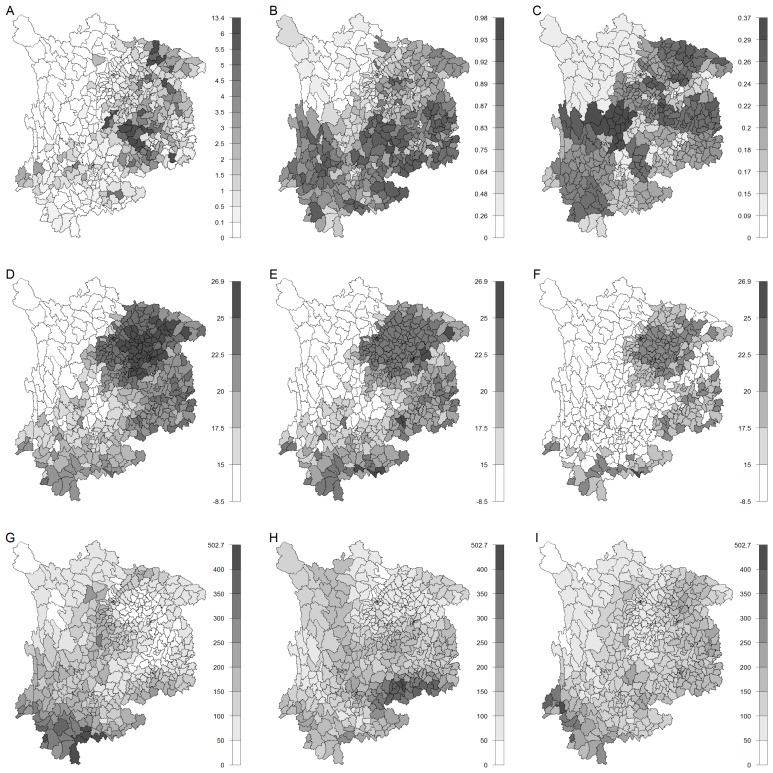
Figure 3.
County-level information in southwest China in 2006. The figure shows the following information in 2006 at the county level: (A) the crude monthly incidence in August (number of cases per 100,000); (B) the proportion of rural population; (C) the pig density (the number of pigs per 1,00 people); (D) the monthly mean minimum temperature in July; (E) the monthly mean minimum temperature in June; (F) the monthly mean minimum temperature in May; (G) the precipitation in July; (H) the precipitation in June; and (I) the precipitation in May.

