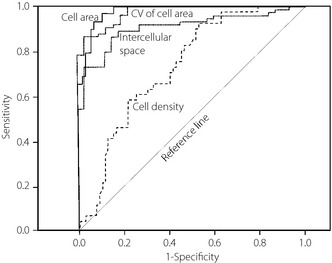
Figure 4.

Receiver operating characteristic (ROC) curves establishing cut‐off levels between controls and type 2 diabetic patients for size of corneal epithelial basal cells (CEBCs), density of CEBCs, coefficient of variation (CV) of CEBC area and width of intercellular space, all of which were visualized by corneal confocal microscopy (CCM). Data were analyzed by Photoshop Elements 8.0 (Adobe Systems Inc. San Jose, CA, USA) and Simple PCI (Compix Inc. Cranberry Township, PA, USA).
