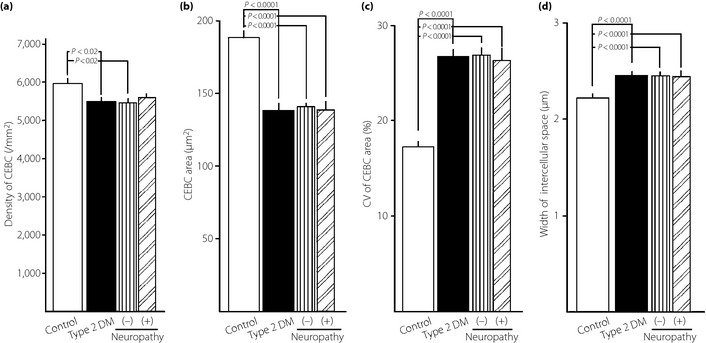
Figure 5.

Comparison of the (a) density of corneal epithelial basal cells (CEBCs), (b) area of CEBCs, (c) coefficient of variation (CV) of CEBC area and (d) width of intercellular space between neighboring CEBCs among controls and type 2 diabetic patients (T2DM) with (+) or without (–) diabetic neuropathy (DN) assessed by the simplified diagnostic criteria14 proposed by the Japanese Study Group of Diabetic Neuropathy. CEBCs were visualized by corneal confocal microscopy (CCM) and analyzed by Photoshop Elements 8.0 (Adobe Systems Inc. San Jose, CA, USA) and Simple PCI (Compix Inc. Cranberry Township, PA, USA). Values are presented as mean ± standard error of the mean. The significance of differences between groups was determined by analysis of variance.
