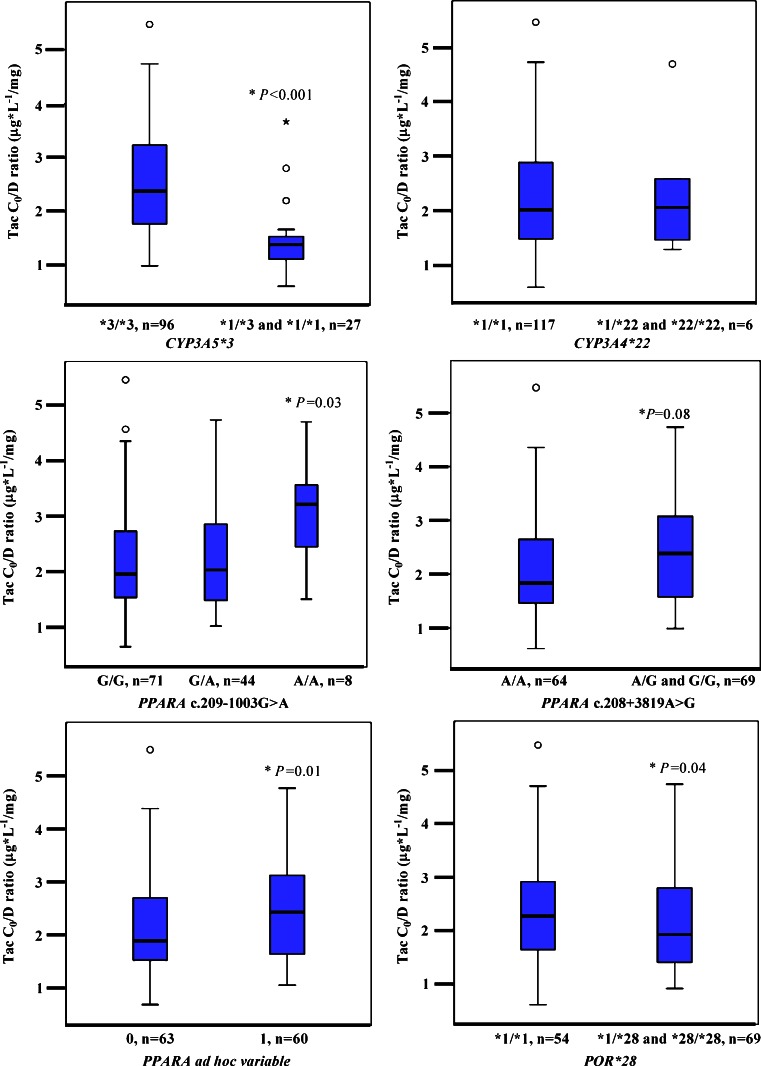
Fig. 1.
Tacrolimus C0/D ratio (μg*L-1/mg) as a function of CYP3A5*3, CYP3A4*22, PPARA c.209-1003G>A, PPARA c.208 + 3819A>G, and POR*28. The box-and-whisker plots indicate interquartile ranges (boxes), medians (horizontal lines in the boxes), and the highest and lowest values (whiskers above and below the boxes). P values are related to the ANOVA test, described under Results. C0/D, dose-adjusted concentrations before dosing; CYP, gene encoding cytochrome P450; PPARA, gene encoding the nuclear receptor peroxisome proliferator-activated receptor alpha; POR, gene encoding cytochrome P450 oxidoreductase

