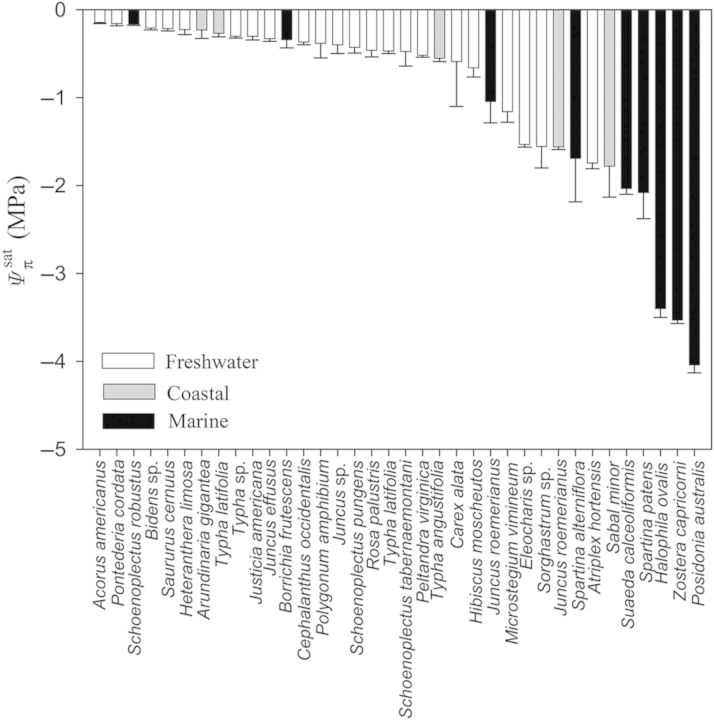
Figure 2.
Solute potentials at full saturation ( ) of aquatic and wetland plants considered in this study. Data include values reported for different species and their respective environmental conditions including freshwater (white bars), coastal (grey bars) and marine (black bars). Data, where applicable, are presented as means ± 1 SE.

